So, what actually happened on December 26, 2025 in the prop firm environment?
Hello, this is Bulenox Trader.
In this presentation, I’m going to review a concrete opportunity that the financial markets offered us with Bulenox.
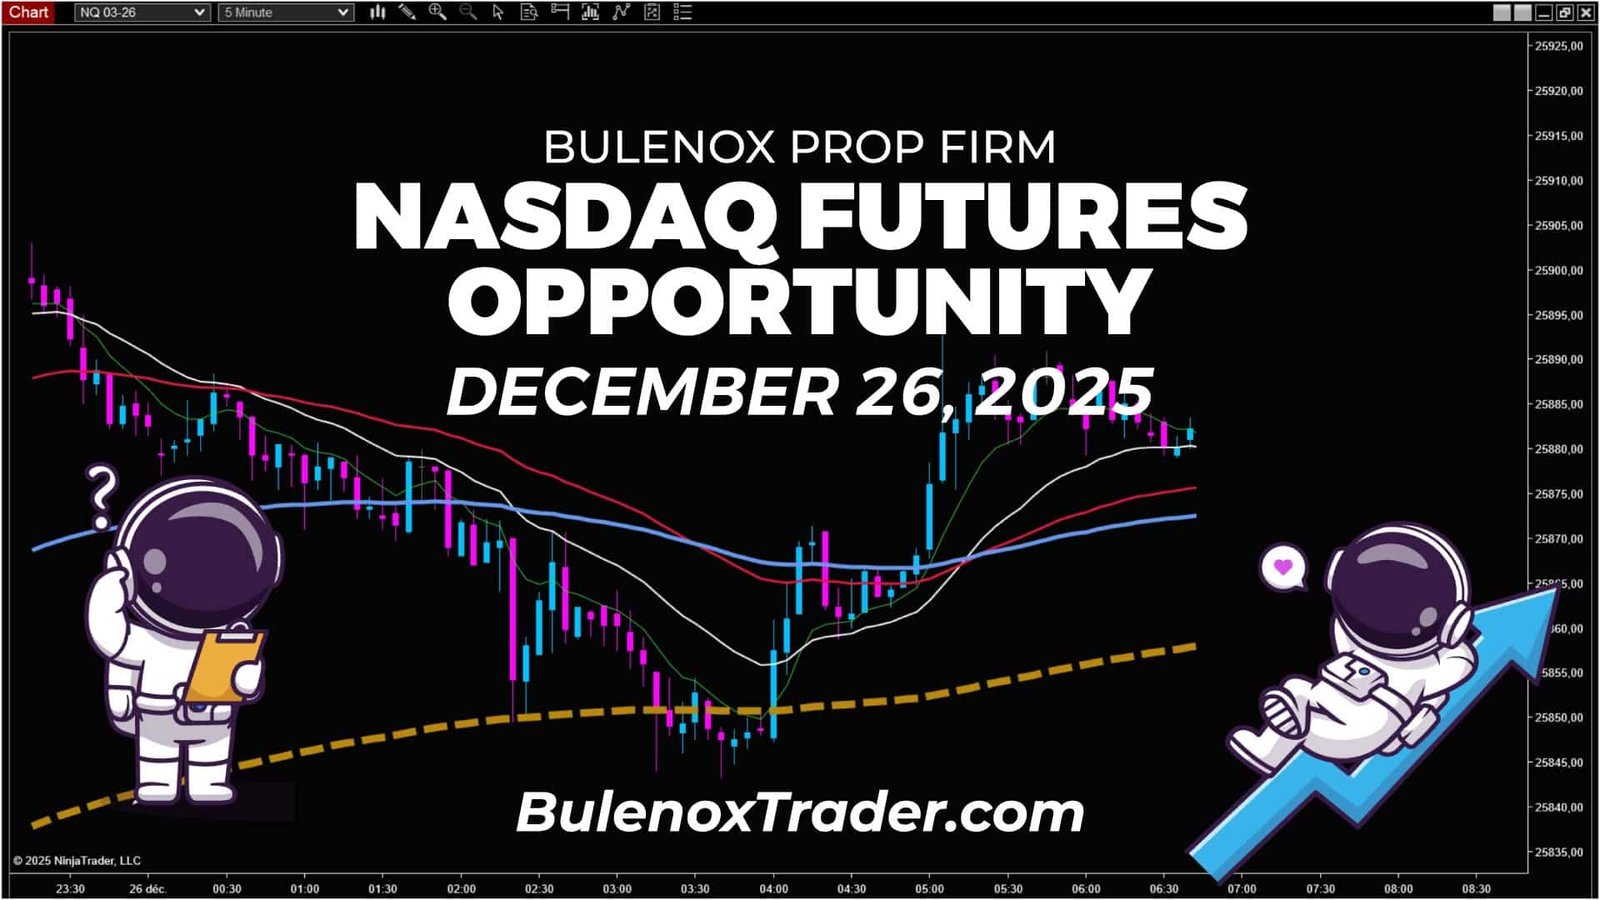
Market context – Nasdaq futures | December 26, 2025 | 5-minute timeframe

On December 26, 2025, while observing the futures markets, my attention turns to the Nasdaq futures, the NQ 03-26.
I’m looking here at a 5-minute chart, during the New York session, with the chart timestamped in UTC-5.
On the screen, it’s very clear that the market is coming out of a strong decline. During the previous hours, selling pressure was heavy and price gradually drifted lower.
Between 03:15 and 03:30 UTC-5, price comes into contact with the 210 moving average. The market reaches it, tests it, and fails to establish itself sustainably below it. The rejection is visible. The downside momentum slows.
From that point on, price behavior changes. The market starts to turn higher, without excessive acceleration, but with a structure that gradually rebuilds. Then, after this initial recovery, the moving averages begin to align.
Around 05:30 UTC-5, a visual change becomes obvious on the chart. At that precise moment, you can observe on the image that the moving averages start to realign progressively in the same direction.
The fast EMA (in green), the slow EMA (in white), the EMA 50 (in red), and the EMA 100 (in blue) stop diverging and regroup coherently in the central area of the chart. This realignment occurs just above the higher-timeframe baseline moving average, shown with an orange dashed line, which clearly acts as a trend pivot during this sequence.
This entire visual configuration allows me to identify a market dynamic that is now clearly oriented to the upside.
Trading via Bulenox – Polarity zone and planned approach
From this point on, for me, the read is already clear.
The market has moved back above the baseline moving average. The other moving averages have realigned. The structure is in place.
At this stage, I’m no longer looking for signals. For me, they’re already there.
What I’m waiting for now is not a direct continuation higher, but a correction. A market pause. Something clean, without questioning the structure.
I expect this correction to take place within the moving average zone, between the short-term and intermediate averages, with a particular focus on the 100 moving average.
Looking at the chart, a polarity zone is clearly visible. It sits exactly within this confluence area, as shown in the animation just above.
My idea is simple.
I wait for price to come back and work below this zone, in contact with the blue moving average visible in the animation. I let the market breathe. I let it test.
This is the exact area where I choose to position myself. Given the structure, the alignment of the moving averages, and the zone as it appears on the screen, an entry around 25,875 fits perfectly with my reading of the sequence and with the typical behavior of the Nasdaq.
From there, I let the market do its job.
Entry and exit within the NQ move
Price eventually comes back into this zone, but the market doesn’t provide an immediate clear response. It works. It oscillates. It tests the zone in small sequences.
Price dips below the blue moving average area, then reclaims it. It moves slightly above, then comes back again to work the level. Nothing is aggressive. Nothing is disorganized.
This behavior is important. It shows that the correction remains controlled and that the bullish structure is not being challenged.
During this phase, I enter the position around 25,875, exactly where the read remains consistent with the existing structure and with the way the Nasdaq typically behaves in this type of configuration.
It’s not a perfect entry point, but for me, it’s a logical one, right in the middle of the zone.
From that moment on, I no longer intervene.
My entry is set at 25,875 and my take profit is placed at 25,895, just below the last high.
The recovery then develops progressively. Price moves higher without excessive acceleration. The extension naturally unfolds toward the previous highs. You can clearly see the market coming to test this area without major hesitation.
My target, deliberately placed below the last visible high, is reached. The position is closed around 25,895.
Price continues higher afterward, but I chose to play it safe. In this sequence, the validated move represents 20 points on the Nasdaq.
In practical terms, those 20 points obviously don’t have the same impact depending on the contract used.
– With 3 micros, that represents roughly $120.
– With 5 micros, it’s around $200.
– With one mini Nasdaq contract, those same 20 points represent roughly $400.
This is exactly the type of range that prop firm accounts like Bulenox allow traders to exploit, with exposure adapted to their level and risk management.
Conclusion on this daily opportunity with Bulenox prop firm

Nasdaq futures NQ 5-minute chart from December 26, 2025 showing a pullback entry into the EMA moving average band, a directional move, and a reached exit zone within a Bulenox prop firm context.
This December 26, 2025 sequence perfectly illustrates what the market can offer when the context is respected, especially within a prop firm framework like Bulenox.
A strong decline.
A clear rejection on the baseline moving average.
A gradual rebuilding of the structure.
A visible realignment of the moving averages.
Then a clean correction before extension, with an exploitable range.
Nothing was blindly anticipated. Nothing was forced.
Everything was built step by step, directly on screen, on a 5-minute chart, timestamped in UTC-5, during the New York session.
The entry was taken in a logical zone, clearly materialized on the final chart snapshot.
The exit was deliberately conservative, as you can see with the take profit strategically placed below the last high.
The market did the rest.
On this opportunity, the Nasdaq would have allowed roughly 20 points to be validated, in a readable, controlled context that is fully compatible with prop firm constraints.
This is exactly the type of move I aim to highlight here, with Bulenox.
When conditions are aligned, this type of sequence exists.
The goal of this presentation is simply to show what can be captured in the markets, day after day, without trying to over-interpret or over-trade.
I deliberately show winning moves.
An article focused on losing moves wouldn’t bring any value, that goes without saying.
And as we often say, what matters isn’t trying to show everything, but showing what actually makes sense.
Alright, that’s it for me.
I hope this presentation style brought you value.
If you want to try Bulenox at a lower cost, you can use the promo code GETFUNDED89 to save -89 % on the website => Bulenox.com
See you next time. Peace.