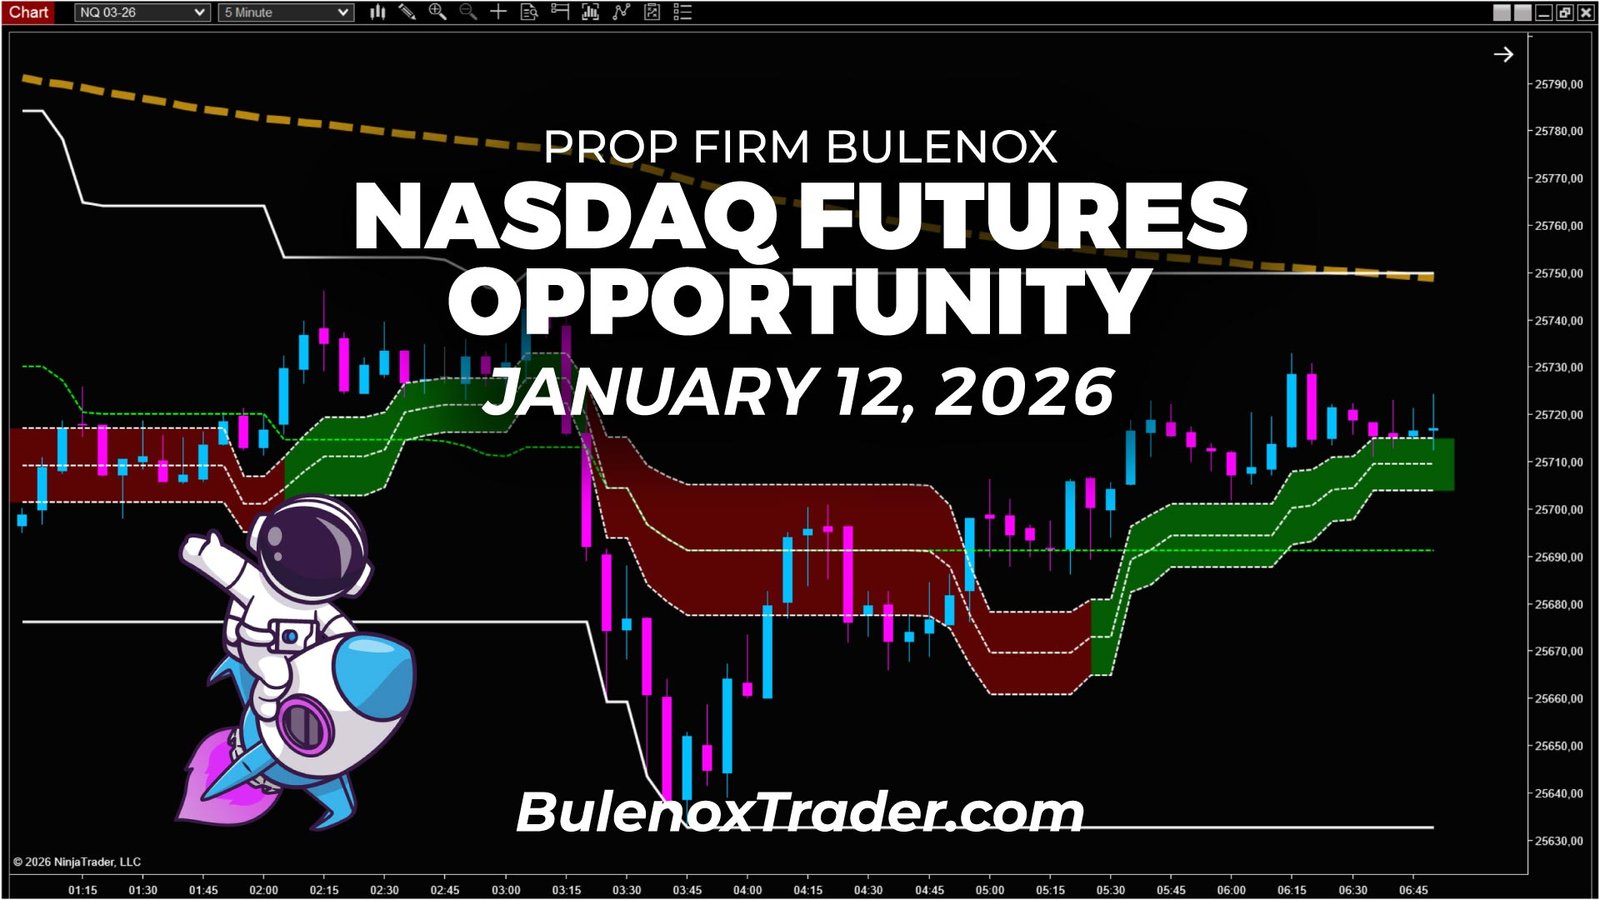
January 12, 2026, New York session.
At 06:50 UTC-5, I’m in front of Nasdaq futures.
I start the session in scalping mode, within a prop firm context with Bulenox.
At that precise moment, I am not looking for an opportunity.
I am trying to understand where I actually stand in the market, by observing what price is telling me… and more importantly, what my indicators are telling each other.
Initial market read – 06:50 UTC-5 | 5-minute timeframe
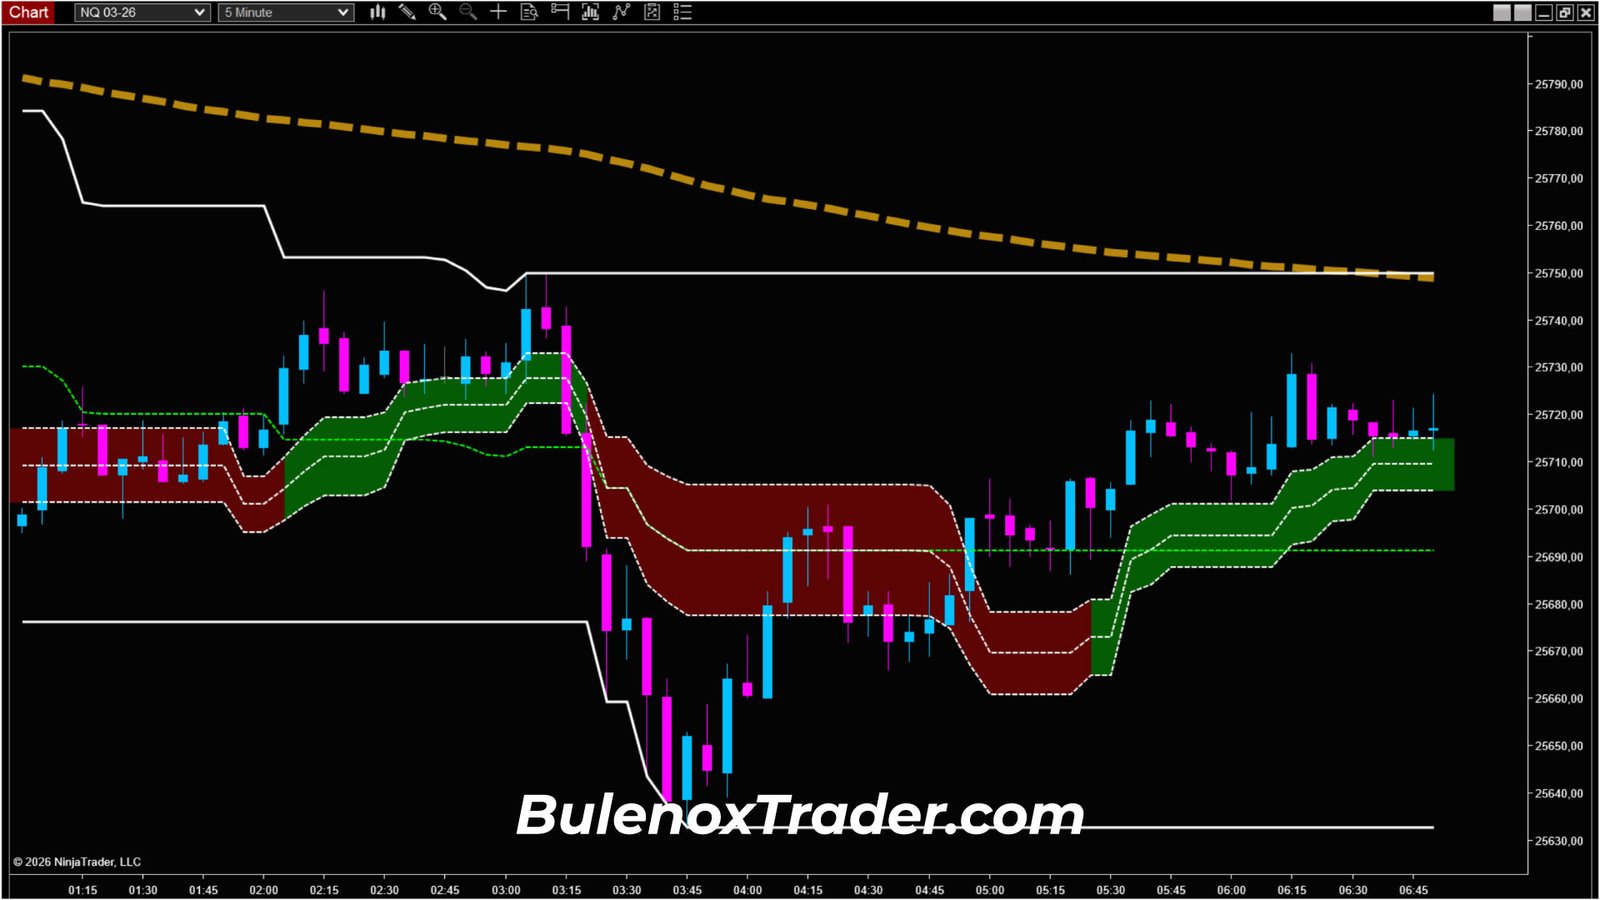
Looking at the 5-minute chart, the first thing that stands out is the underlying trend.
As you can see on the snapshot, price is trading below the baseline structuring moving average.
The overall dynamic therefore remains bearish.
But very quickly, the read becomes more complex.
On the same chart, price has moved back above the 50% level of the Donchian channel.
At the same time, the Dynamic FiboTrend on the 5-minute timeframe is pointing upward.
I am therefore faced with two opposing reads:
- an underlying structure that is still bearish,
- a momentum that is temporarily shifting to the upside.
No immediate scenario – Divergent read
In this type of configuration, I do not have a sufficiently clear read.
On one hand, some elements argue in favor of a bearish continuation.
On the other hand, certain signals suggest a bullish recovery phase.
The result is simple.
I am in a zone of flow divergence.
I do nothing.
I remain in observation mode.
Conditions required to consider a scenario
At this stage, as long as signals remain divergent, I do not take a stance.
Only two configurations can make the session exploitable.
Scenario 1 – Bearish continuation with signal convergence
A move back below the 50% level of the Donchian channel, combined with a shift of the Dynamic FiboTrend into a bearish bias.
In that case, the underlying trend and momentum would finally be telling the same story.
Scenario 2 – Bullish structural shift
A breakout and acceptance above the baseline structuring moving average.
The 5-minute structure would then flip into a clear bullish trend, and I would only look for bullish corrections.
As long as neither of these scenarios is clearly validated, the decision remains the same: wait.
Context evolution after the US Open
After the US Open, the context gradually starts to evolve.
As you can see on the snapshot, indicators slowly realign to the upside.
The baseline structuring moving average is reclaimed.
Momentum shifts to the buy side.
The structure progressively flips into a bullish bias.
At this stage, I still do not trigger anything.
I simply observe whether this new structure holds.
Waiting for a correction on the Dynamic FiboTrend – 5-minute timeframe
Rather than chasing the move, I deliberately wait for the market to breathe.
The expected correction takes time to develop.
It is only around 12:40 UTC-5 that price finally prints a clean correction on the Dynamic FiboTrend on the 5-minute timeframe.
This zone acts as a dynamic support within the bullish structure under construction.
The support is clear.
The context remains healthy.
Only from that moment do I prepare the transition to the lower timeframe.
Entry timing – 1-minute timeframe
I switch to the 1-minute chart to refine the timing.
I do not anticipate anything.
I wait for a simple, readable validation.
As you can see on the snapshot, price breaks above the SuperTrend, located around 25,958.
👉 Entry point: 25,958, triggered on the SuperTrend breakout.
Target and trade management
For this trade, I choose a slightly more ambitious target than average.
👉 Target: 30 points
The objective is located around 25,988.
A more conservative 25-point target would have been possible.
Here, the trend context and the cleanliness of the move justify an attempt at 30 points.
Financial equivalence
The move represents 30 points on the Nasdaq.
- 3 micros → approximately $180
- 5 micros → approximately $300
- 1 mini → approximately $600
Session summary – January 12, 2026

From the very start of my analysis at 06:50 UTC-5, the session does not offer an exploitable scenario.
Indicators are not aligned.
The read is contradictory.
I choose to wait.
After the US Open, the structure progressively reorganizes into a bullish bias.
The trend starts to build, but the timing is still not there.
Several hours are required before the market finally offers a clean configuration.
The correction on the Dynamic FiboTrend on the 5-minute timeframe, around 12:40, makes the session exploitable.
The switch to the 1-minute chart allows precise timing.
The SuperTrend breakout validates the entry.
The trade is simple, structured, and executed without rush.
This session clearly summarizes the work of prop firm scalping:
- a lot of observation,
- very few actions,
- and an intervention only when the market allows it.
See you next time.
Peace.
If you want to test Bulenox at a lower cost, you can use the promo code GETFUNDED89 which gives you -89 % on the site => Bulenox.com
Discover more opportunities offered by Bulenox
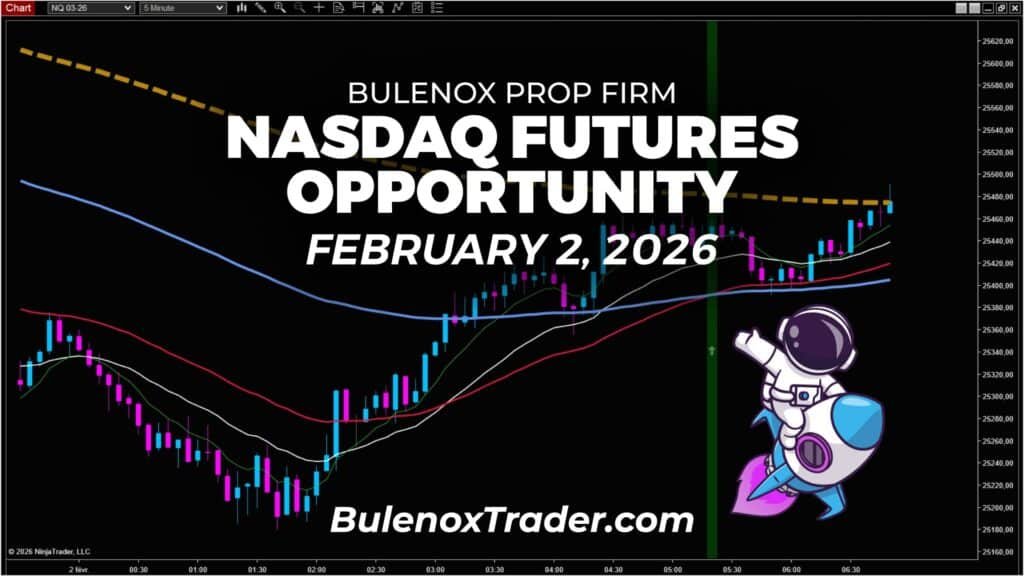
NQ Bullish Shift Opportunity | Bulenox, February 2, 2026
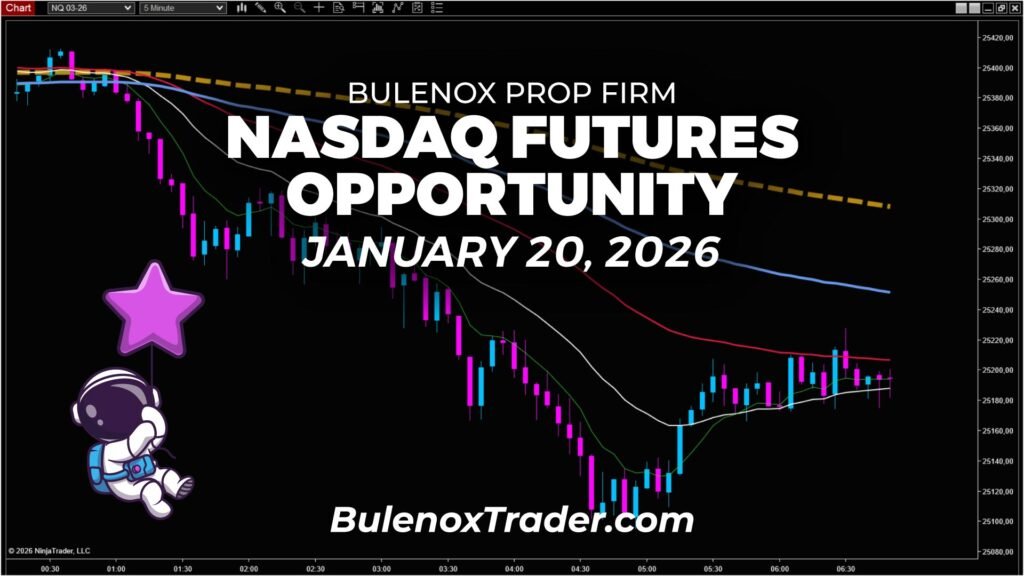
NQ: Complex Pullback, Bulenox Sniper Entry | January 20, 2026
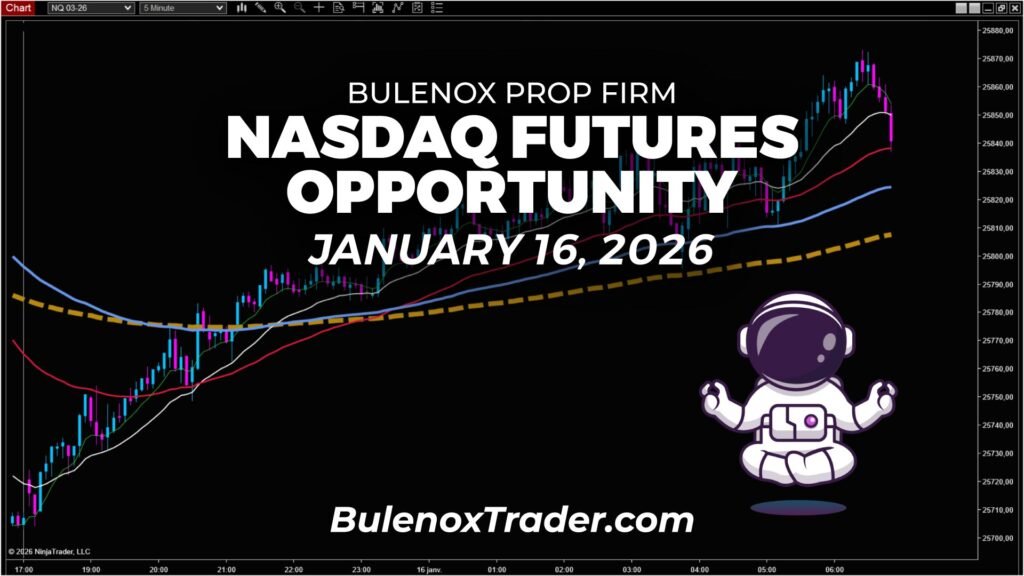
Break of the Bullish Bias on the Nasdaq | January 16, 2026
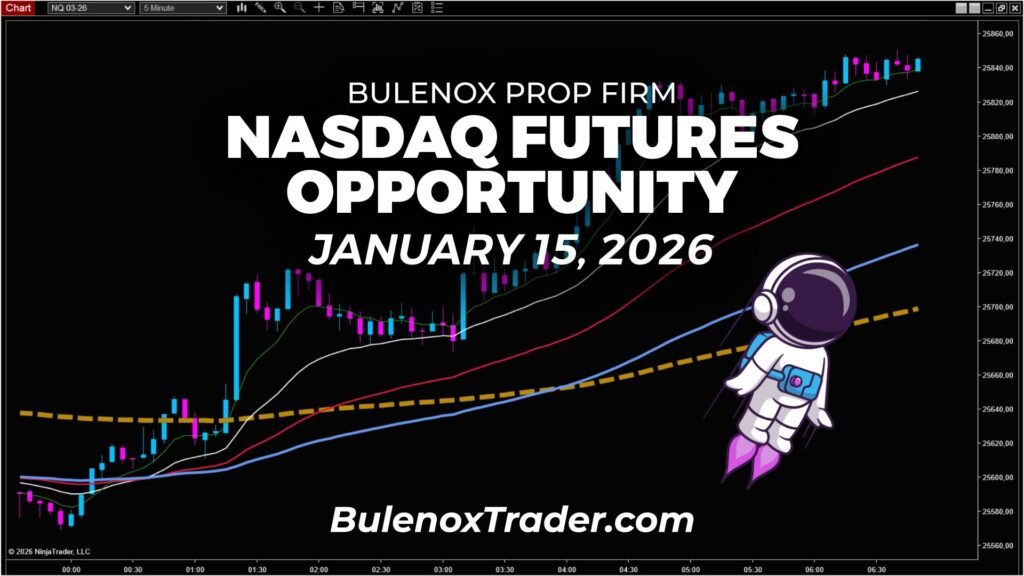
Exploiting a Bullish Bias on the Nasdaq | January 15, 2026
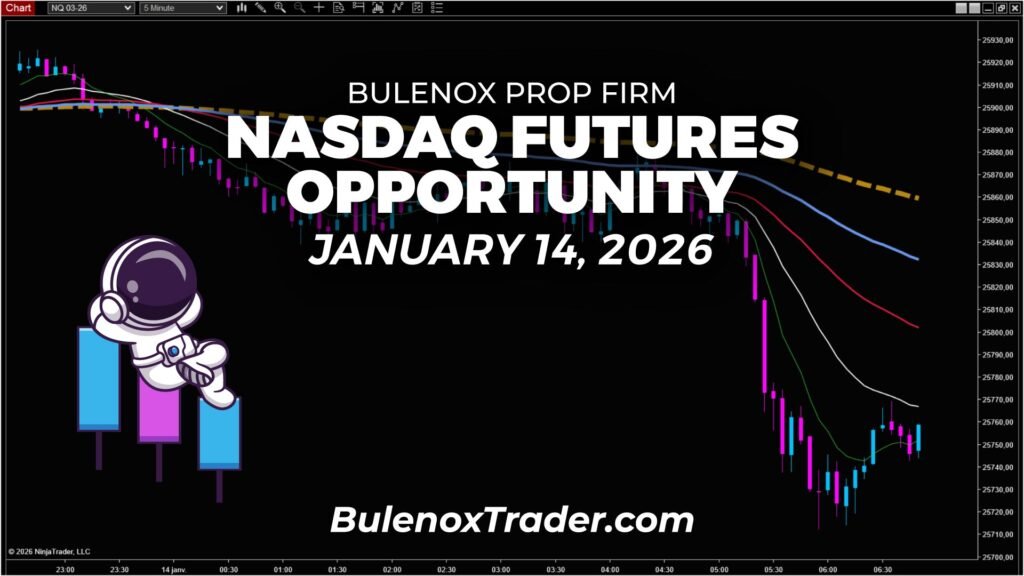
How I Trade the Nasdaq with Bulenox | January 14, 2026
