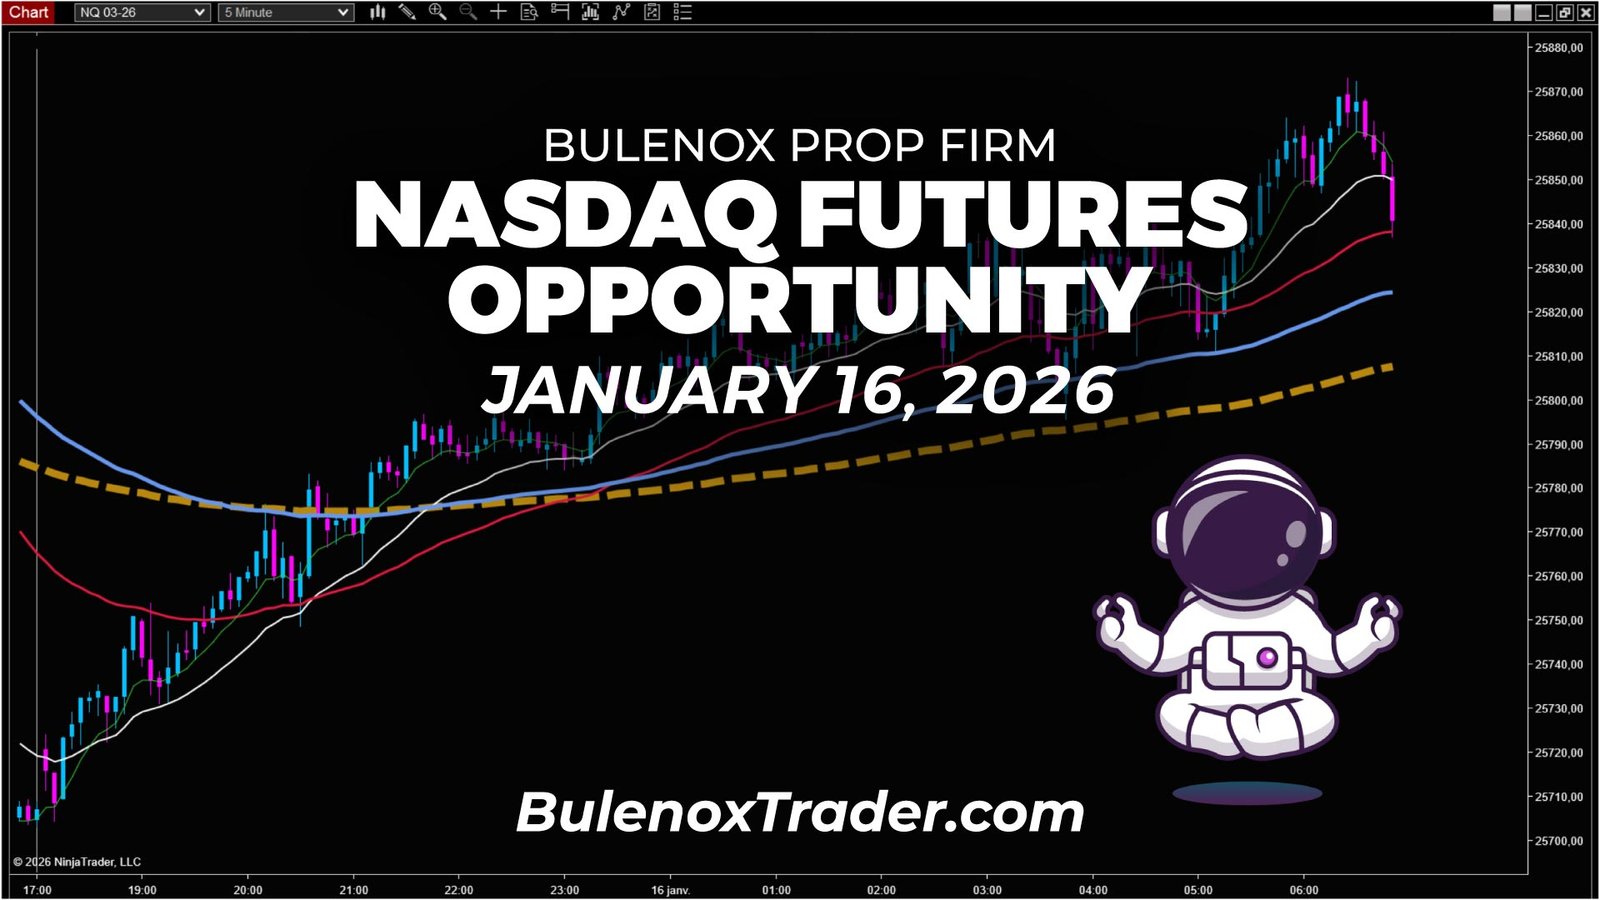
January 16, 2026 starts with a Nasdaq that still looks bullish on the surface.
On the 5-minute timeframe, the structure is holding. Moving averages remain aligned, and several corrections have already developed within the flow. The zone has been worked since the Asian open. I remain open to a continuation, but without certainty.
From the first reads on the 1-minute timeframe, the Dynamic FiboTrend becomes central.
It attempts a bullish continuation in a logical area, but the signal does not trigger any follow-through. No continuity, no confirmation. I have no reason to intervene.
At the US Open, a new signal appears.
This time, the issue is not the read, but volatility. Ranges become too wide. In this context, I can no longer apply proper risk management with my scalping methodology. I choose to stay on the sidelines.
A few minutes later, the market makes a clear decision.
The bullish trend breaks sharply. The drop is fast, violent, and unambiguous. From that point on, I stop looking for long scenarios and resume the analysis with a bearish framework.
The market becomes exploitable again around 10:55 UTC-5.
On the 5-minute timeframe, the flow turns bearish. A pullback returns to the moving average zone. On the 1-minute timeframe, the Dynamic FiboTrend first shifts into correction, then flips back bearish. I then wait for the SuperTrend break to validate my timing.
One trade.
A simple target.
A context that finally becomes readable.
This session mainly highlights the value of the Dynamic FiboTrend as a filter.
It allows aborted signals to be ignored, overly volatile phases to be avoided, and intervention only when the market becomes coherent again with the underlying structure.
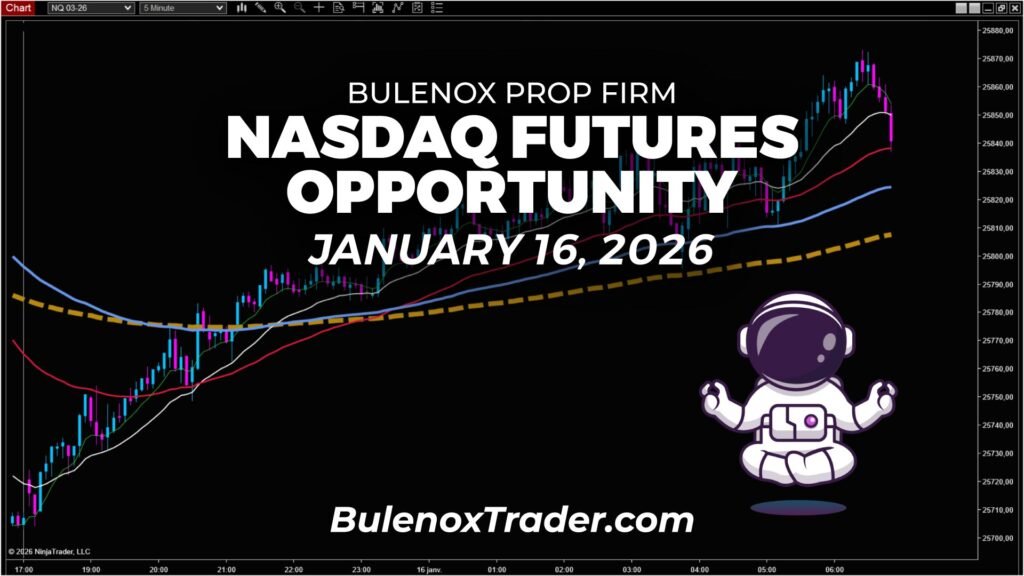
January 16, 2026, New York session.
I start my Nasdaq futures read at 06:50 UTC-5.
On this 5-minute snapshot, you can still see a bullish trend holding.
I remain open to a continuation, but I keep some doubt.
Market context – 5-minute timeframe
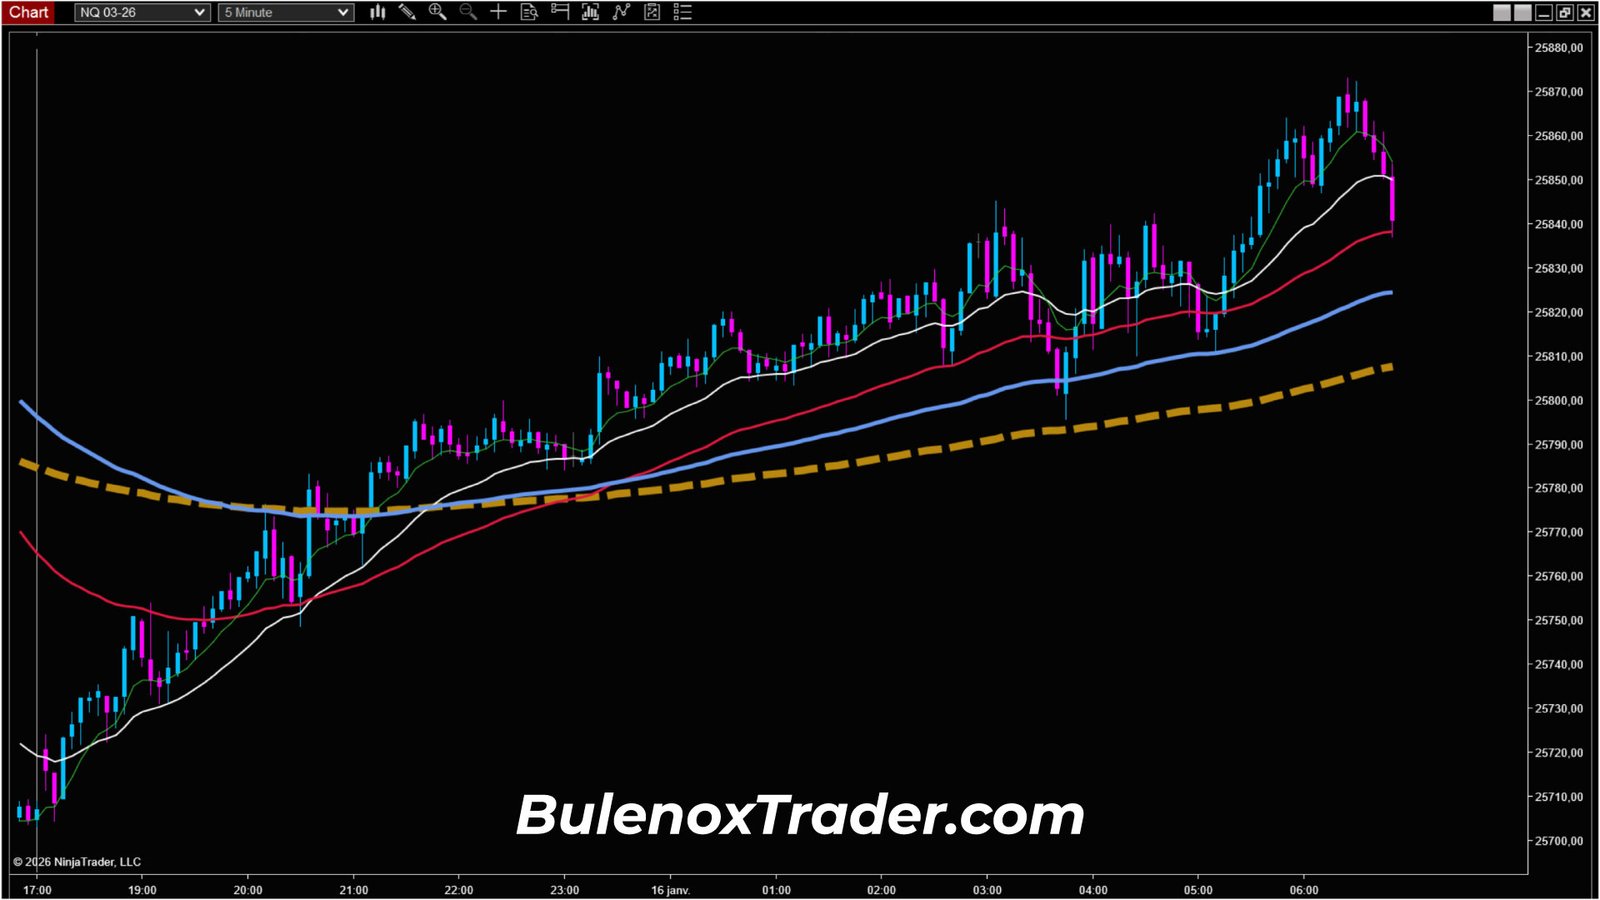
On the 5-minute chart, the market remains broadly bullish.
Structuring moving averages are shaping a clean flow.
You can also see several corrections already developed within this flow.
The rejection zone has already been tested multiple times since the Asian open.
I do not rule out a continuation, but I stay cautious.
First failed continuation attempt – 1-minute timeframe

I switch to the 1-minute timeframe to look for timing.
In the area highlighted on the chart, the Dynamic FiboTrend attempts a bullish continuation.
The signal does not lead to any follow-through.
That’s fine. I have no opportunity to manage at that moment.
US Open – unmanageable volatility
At the US Open, a new signal appears.
The issue is the context.
As you can see on the chart, volatility becomes too high.
I cannot manage proper risk with my scalping methodology.
I choose not to attempt anything.
Bias shift
Shortly after, the market collapses.
The drop is clearly visible.
The bullish trend breaks sharply.
Price loses more than 100 points very quickly.
I consider the bias to have changed.
I restart the analysis with a bearish perspective.
Short setup – 5-minute then 1-minute timeframe
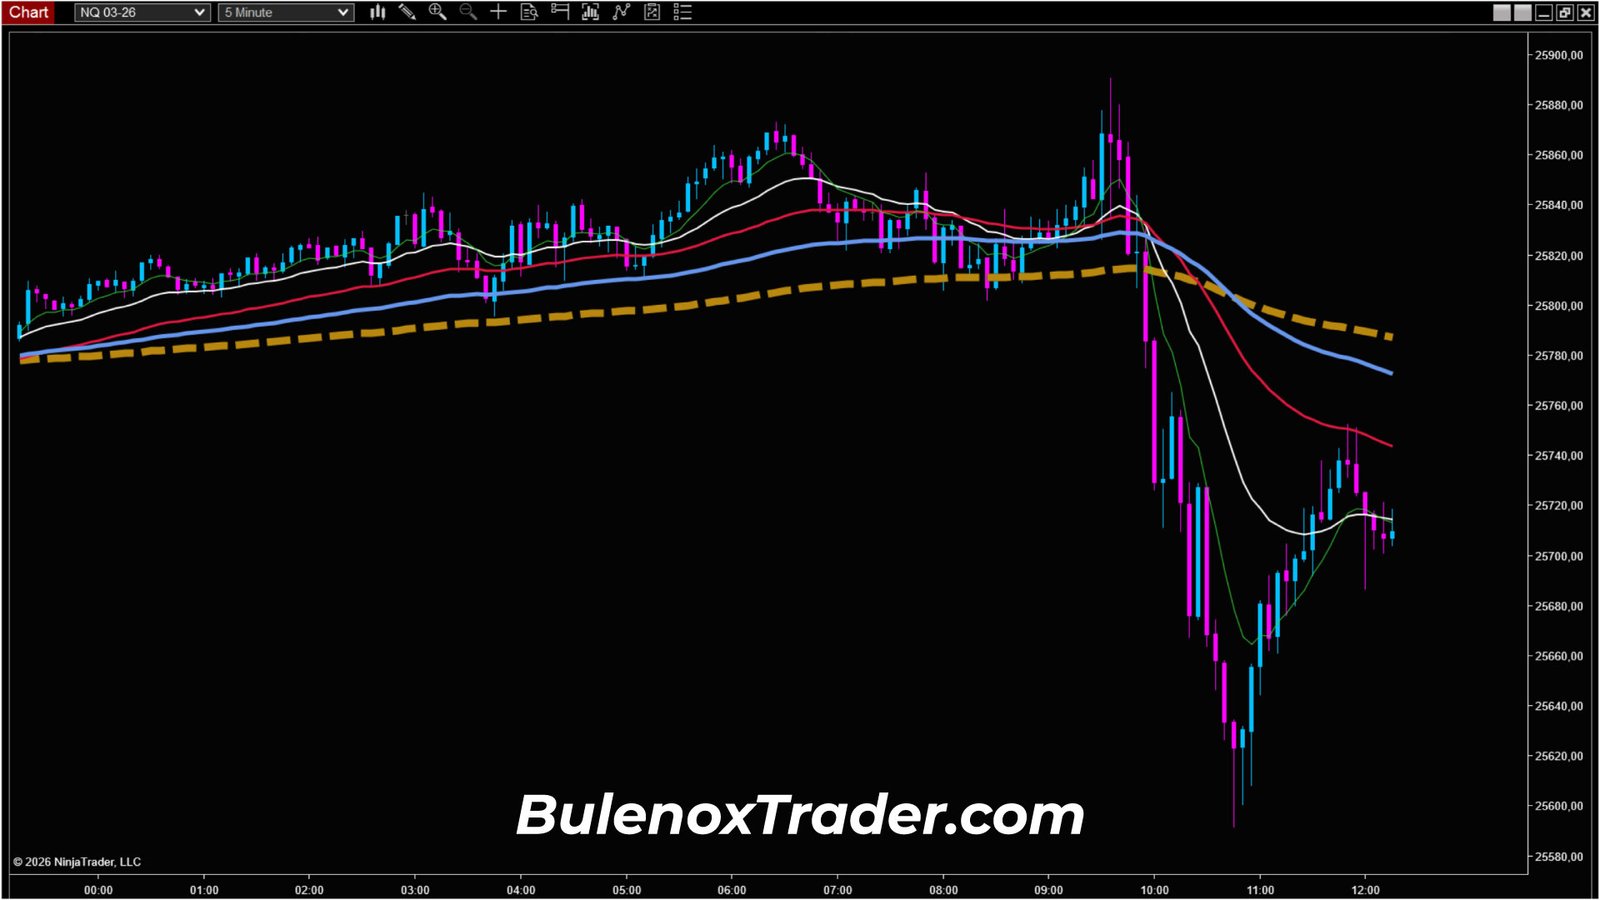
On the 5-minute chart, around 10:55 UTC-5, the flow clearly turns bearish.
Then you can see a pullback within this new downtrend that comes back to test the moving average zone.
This provides a solid base to look for a short entry.
I switch back to the 1-minute chart to execute.
The Dynamic FiboTrend first signals a correction, then flips back to bearish.
I prefer to enter on the SuperTrend break to validate my timing.
The entry can be taken around 25,695.
Execution and exit
A simple target needs to be defined.
I am not looking for aggressive extension.
Exiting at 25,665 is more than sufficient in this case.
The trade takes some time, but as you can see on the snapshot, the structure remains clean.
Financial equivalence
The move covers 30 points on the Nasdaq.
In terms of value, to put it into perspective:
- 3 micros → ≈ $180
- 5 micros → ≈ $300
- 1 mini → ≈ $600
These figures are only meant to visualize the opportunity Bulenox offered on January 16, 2026.
Session review – January 16, 2026

This session does not offer an “easy” opportunity from start to finish.
First, you see a bullish trend still holding on the 5-minute timeframe, but with a zone that has already been heavily worked since the Asian open.
I remain open to a continuation, but I do not force anything.
The first 1-minute signal does not confirm, so I let it go.
At the US Open, I see a signal, but volatility explodes.
In this context, my methodology no longer holds.
I choose to remain a spectator.
Then the market breaks the bullish bias decisively.
The sharp drop validates a real regime change.
From that point on, I mentally switch to a bearish mode.
The read becomes exploitable again around 10:55 UTC-5, when the 5-minute chart flips bearish and a pullback returns to the moving average zone.
I drop to the 1-minute chart, wait for the Dynamic FiboTrend to flip back bearish, then validate timing with the SuperTrend break.
Simple target.
Controlled risk.
No extension sought.
This is exactly the type of session where you mainly win by refusing unclear zones and only intervening when the market becomes readable again.
See you next time.
Peace.
If you want to test Bulenox at a lower cost, you can use the promo code GETFUNDED89 which gives you -89 % on the site => Bulenox.com
Discover more opportunities offered by Bulenox
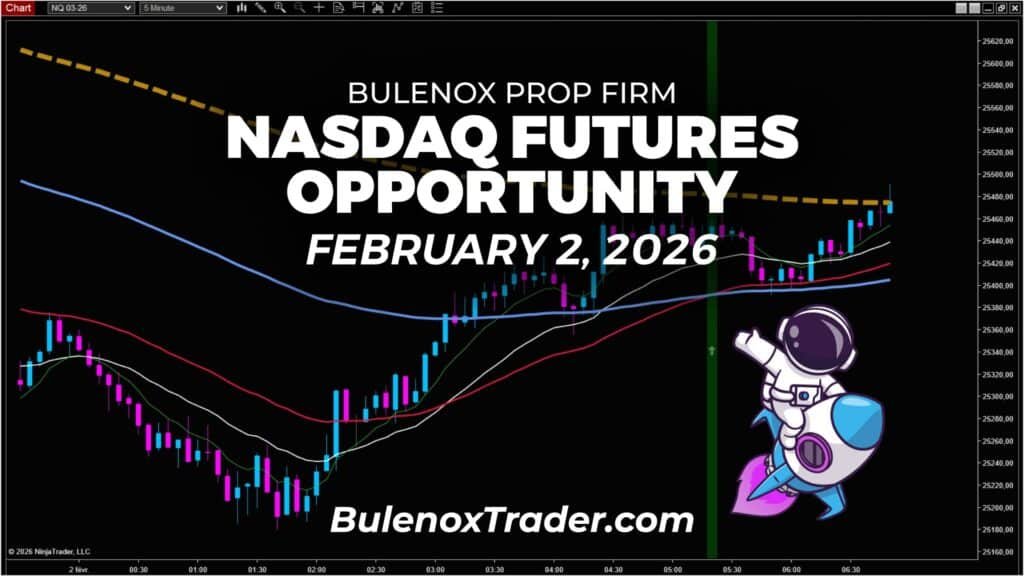
NQ Bullish Shift Opportunity | Bulenox, February 2, 2026
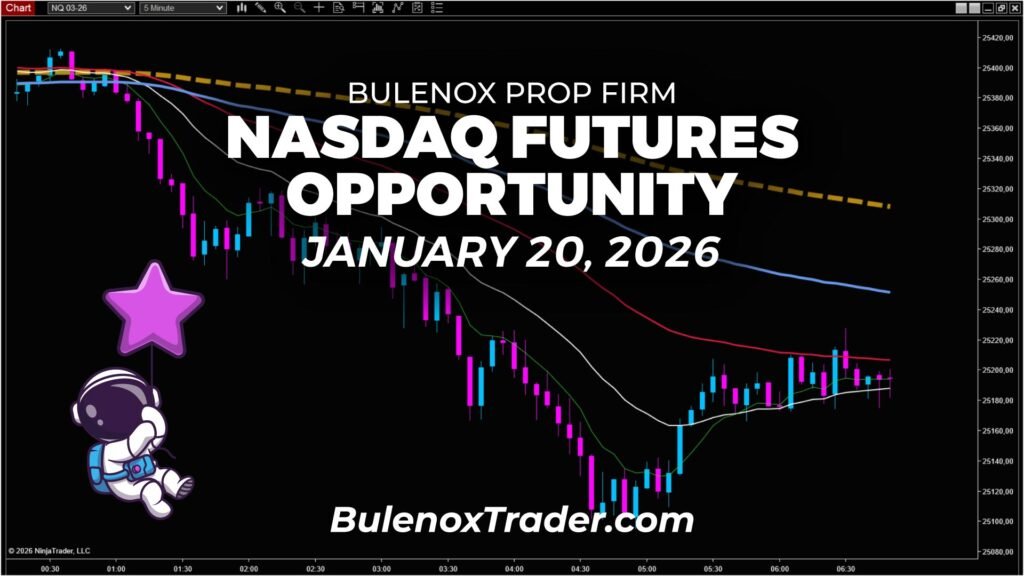
NQ: Complex Pullback, Bulenox Sniper Entry | January 20, 2026
Break of the Bullish Bias on the Nasdaq | January 16, 2026
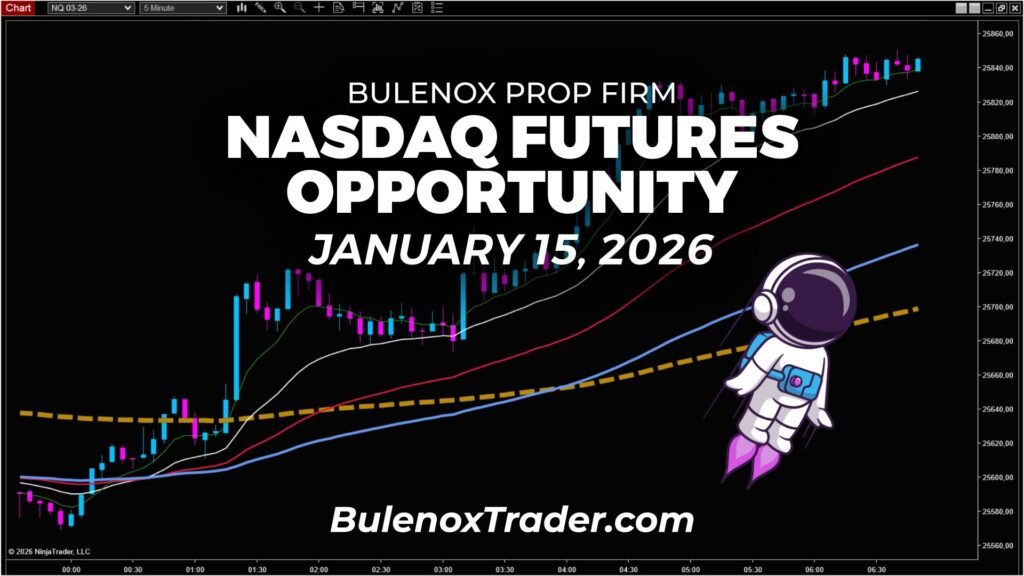
Exploiting a Bullish Bias on the Nasdaq | January 15, 2026
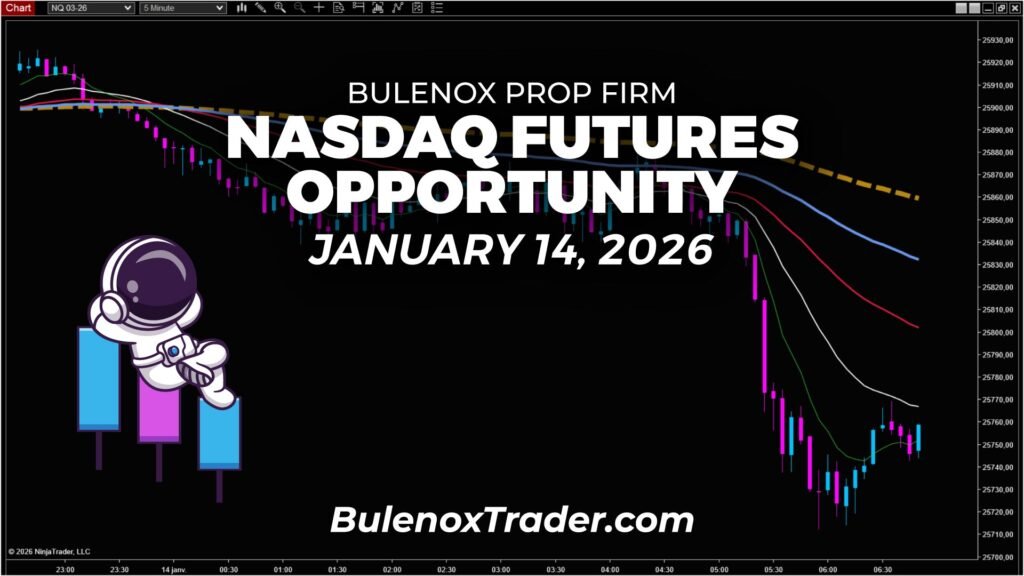
How I Trade the Nasdaq with Bulenox | January 14, 2026
