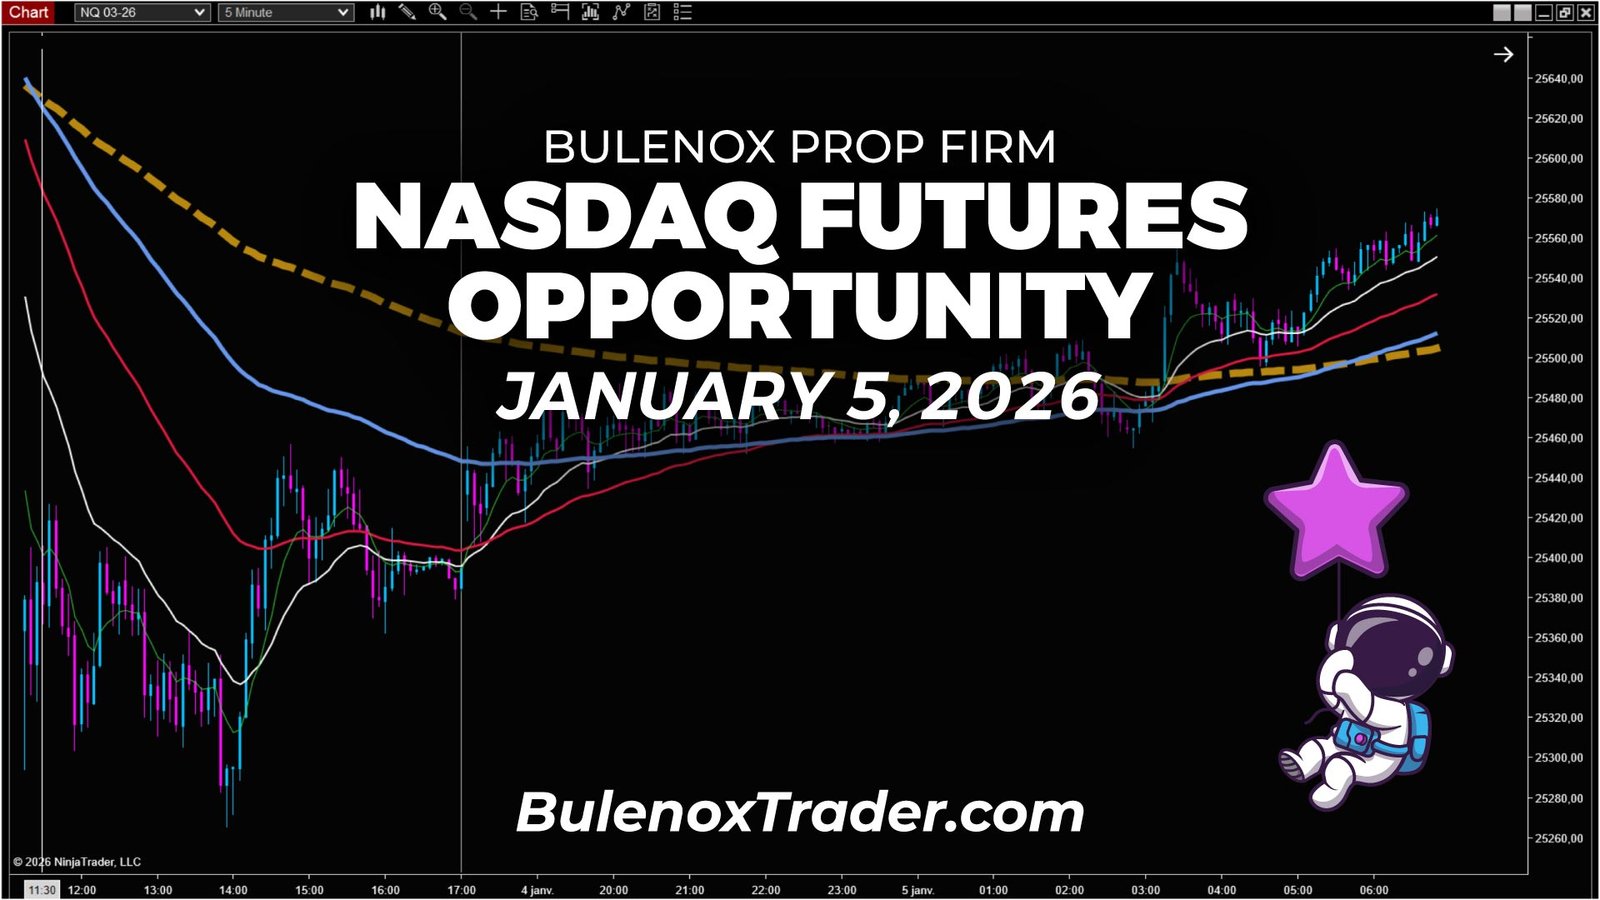
So, what happened on January 5, 2026 on Nasdaq futures, in a scalping context with the Bulenox prop firm?
Hello, this is Bulenox Trader.
In this presentation, I’m going to review a concrete opportunity observed on Nasdaq futures (NQ) during the New York session of January 5, 2026.
Market context – Nasdaq futures | January 5, 2026 | 5-minute timeframe
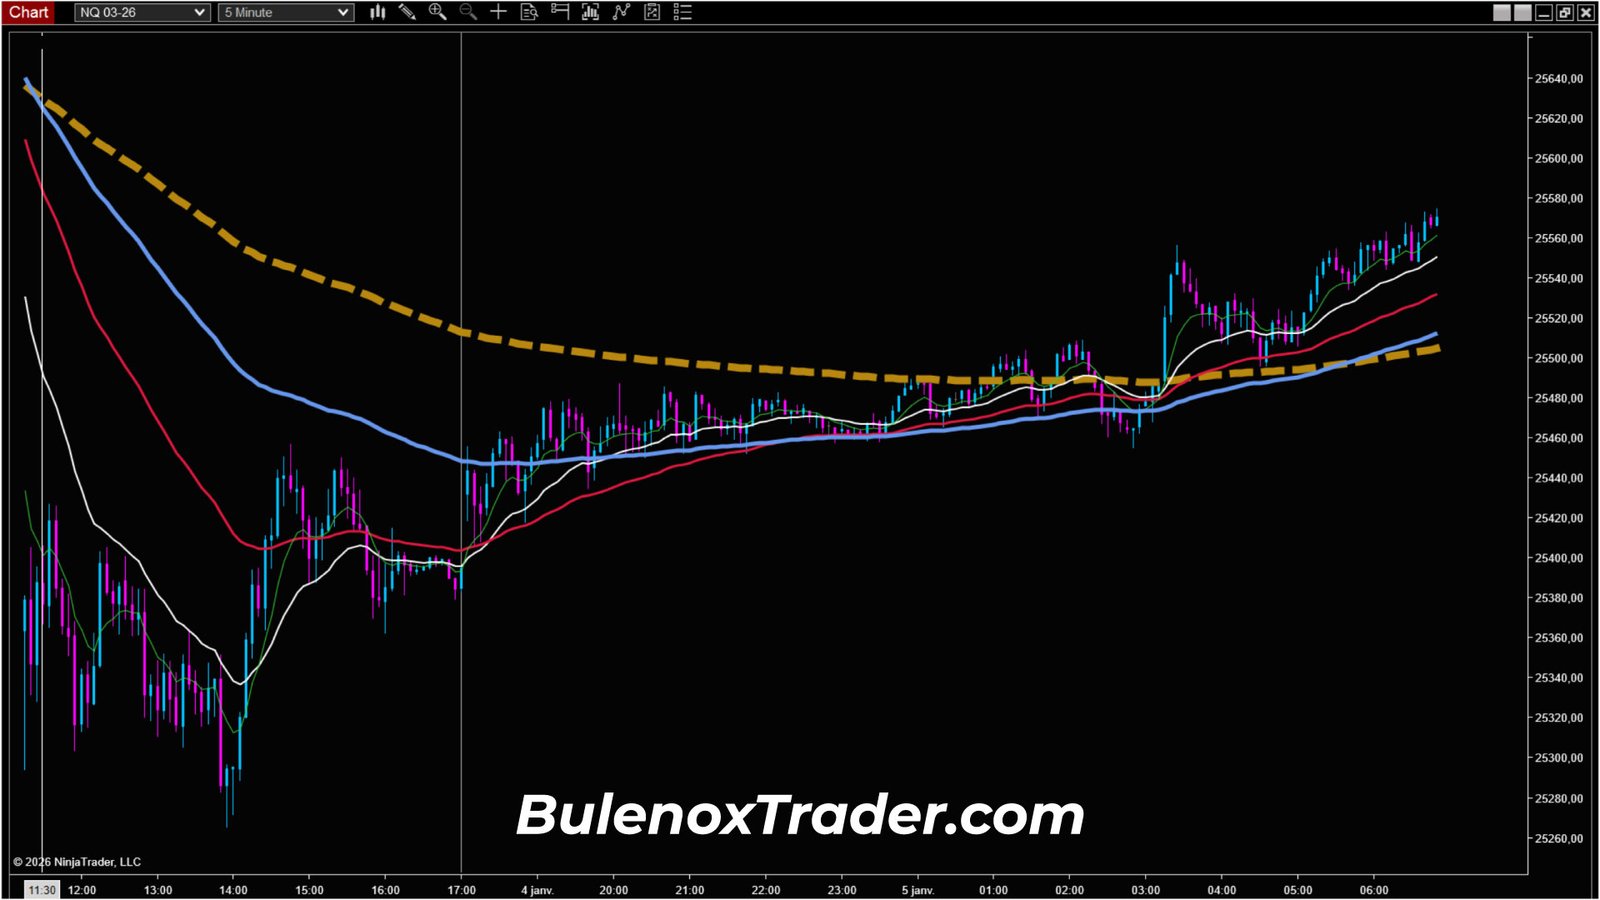
I deliberately start with a 5-minute chart, around 06:50 UTC-5, to identify the market regime before looking for any entry.
On screen, the read is clear.
All the key moving averages are aligned and point to a bullish dynamic that is now established.
Price has been trading above the baseline moving average for some time.
The new information here mainly comes from the internal structure.
The intermediate moving average has just crossed above the baseline trend moving average.
This full alignment validates the regime change on the 5-minute timeframe.
The bullish dynamic is no longer building. It is already in place.
At this stage, an impulse is underway.
The market is in an expansion phase.
In this type of configuration, I do not look for any direct entry.
I never intervene during an impulse.
Trading with Bulenox – Waiting for a structured correction
Once the regime is identified, my plan is simple.
I do not anticipate anything.
I wait for the market to breathe.
I expect this correction in a precise area:
- either within the moving average band,
- or on the median of the Donchian channel,
located around the 50% level of the channel, equivalent to a 50% Fibonacci retracement.
As long as the market remains in expansion, I do nothing.
I wait for price to come back and work this pullback zone.
On the 5-minute chart, this area is clearly marked.
Price eventually comes back into it.
From that point on, the higher-timeframe read is done.
All that remains is to observe the reaction on the lower timeframe.
Switch to the 1-minute timeframe – Reading the reaction
When price returns to the 50% level of the Donchian channel on the 5-minute chart, I deliberately switch to a 1-minute chart.
The role of the 1-minute timeframe is simple.
It never decides direction.
It only validates or invalidates the scenario defined beforehand.
On the 1-minute chart, we observe a controlled pullback:
- price temporarily moves lower,
- it comes to work its structuring moving average,
- this moving average is briefly broken, in confluence with the impact on the 50% Donchian level from the 5-minute chart.
The correction remains clean.
The underlying bullish structure is not questioned.
Then, a 1-minute candle flips and resumes upward, confirmed by my indicators.
This is the exact sequence I’m interested in.
At that moment, the scenario is considered valid.
Trade execution – Entry, target, and exit
Entry zone
After the 1-minute validation, I define a coherent intervention zone.
The entry is located around 25,550.
This level corresponds to a logical starting point, directly derived from the observed correction.
I’m not trying to optimize the tick.
I’m trying to be positioned in the move once the reaction is visible.
Target and management
The last visible high in the structure is located around 25,588.
I deliberately choose a conservative approach.
The take profit is set at 25,585, just before that last high.
The idea is not to capture the entire extension.
The idea is to exit before a zone likely to trigger a reaction.
The plan therefore targets a move between 25,550 and 25,585,
which represents a 35-point move on the Nasdaq.
Result and concrete equivalence
After the entry, the market resumes in the direction of the bullish structure.
A new impulse develops without any degradation of the context.
Price continues higher,
comes into the target zone,
and the take profit is executed.
The 35 points are validated.
In concrete terms, this range represents approximately:
- $210 with 3 micros,
- $350 with 5 micros,
- $700 with one mini Nasdaq.
The market then continues its move, but the plan was executed exactly according to the initial read.
Conclusion – Reading before action

This January 5, 2026 session perfectly illustrates the logic I document here day after day with Bulenox.
- A clear bullish structure on the 5-minute chart.
- An impulse that is not traded.
- A disciplined wait for a correction.
- Price returning to a zone defined in advance.
- Validation exclusively on the lower timeframe.
- Simple execution, without anticipation.
The 1-minute timeframe never decides direction.
It only confirms or blocks a scenario that has already been built.
This type of sequence does not rely on speed or intuition.
It relies on hierarchical timeframe reading and patience.
This is exactly the type of move I aim to document in a prop firm scalping context with Bulenox, when the market offers a readable and exploitable structure.
We stop here for this session.
See you next time.
Peace.
If you want to test Bulenox at a lower cost, you can use the promo code GETFUNDED89 which gives you -89 % on the site => Bulenox.com
Discover more opportunities offered by Bulenox
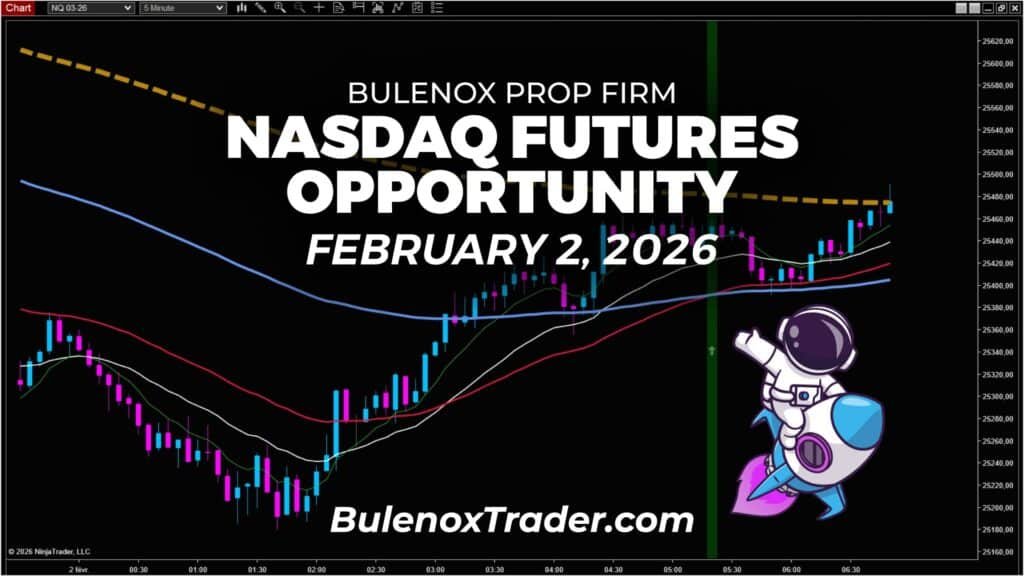
NQ Bullish Shift Opportunity | Bulenox, February 2, 2026
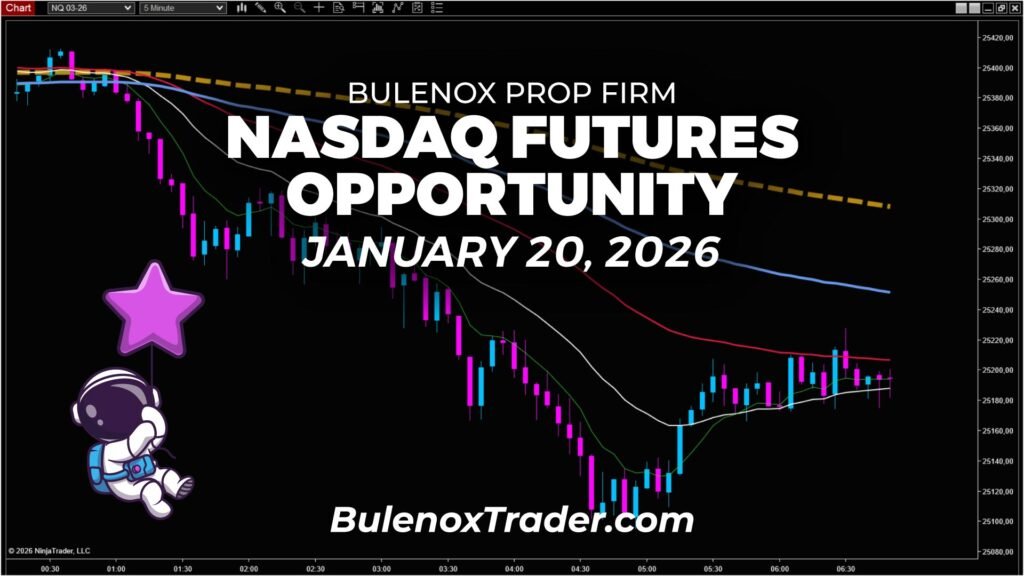
NQ: Complex Pullback, Bulenox Sniper Entry | January 20, 2026
Break of the Bullish Bias on the Nasdaq | January 16, 2026
Exploiting a Bullish Bias on the Nasdaq | January 15, 2026
How I Trade the Nasdaq with Bulenox | January 14, 2026
