Hello, prop firm scalpers.
Today we’re back with a new analysis in Bulenox Trader mode, focused on the New York session of January 2, 2026, on Nasdaq futures (NQ).
In this new episode, I observe what the market offers and walk through the scenarios that present themselves, without trying to force anything.
As usual, the analysis starts around 06:50 (UTC-5).
I begin by observing the 5-minute chart, which allows me to quickly assess the market state before going any further.
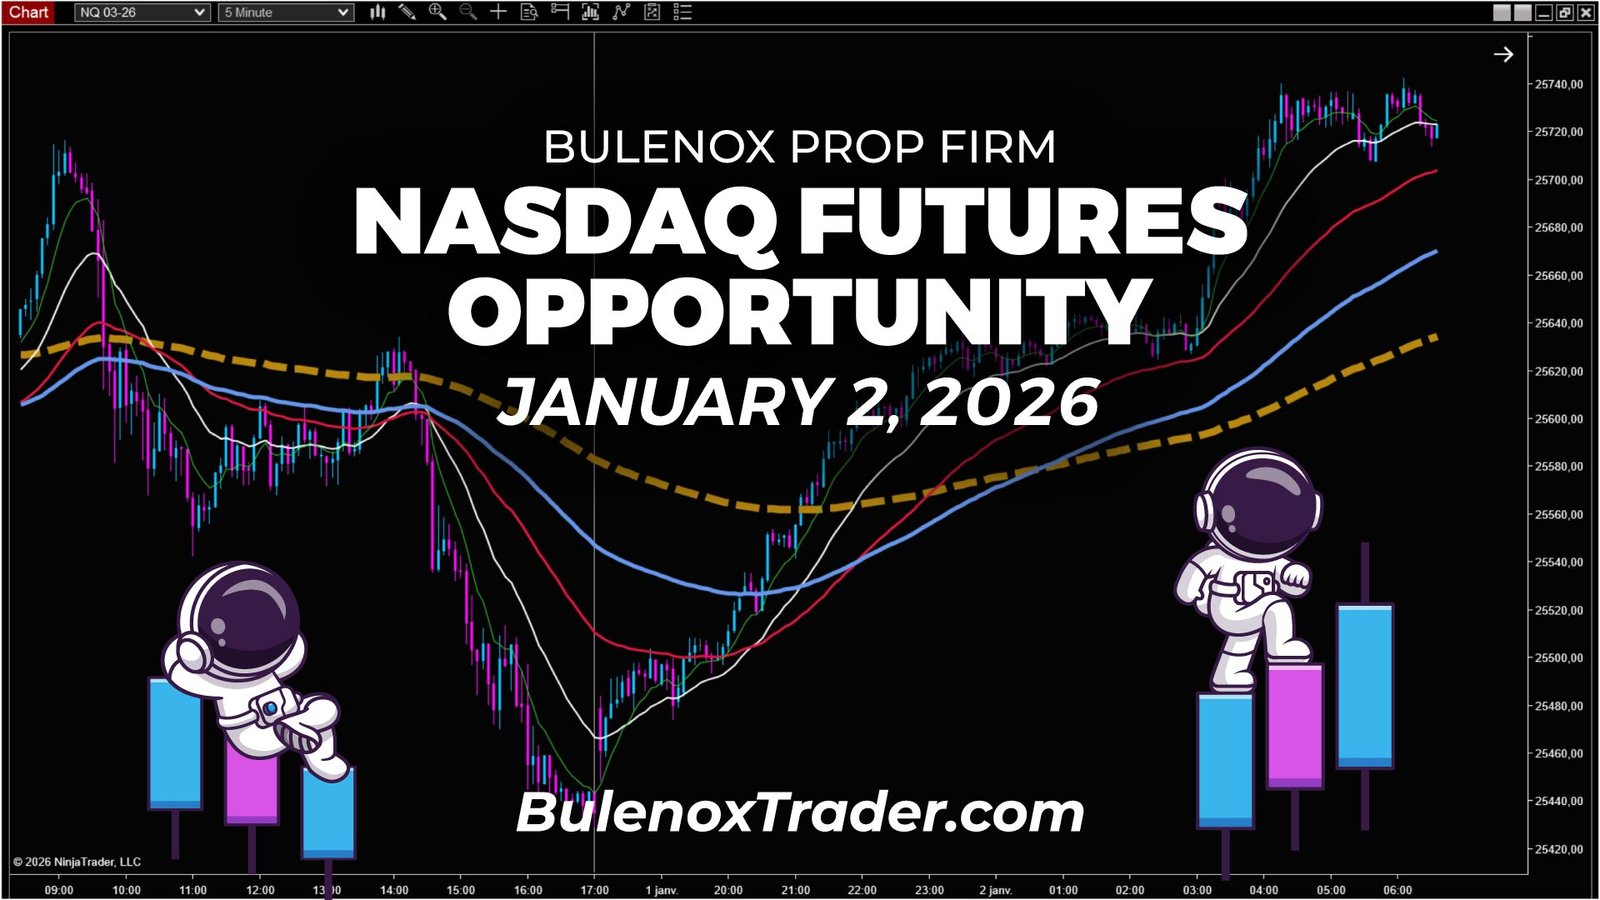
Market context – Nasdaq Futures | January 2, 2026 | 5-minute timeframe
At 06:50 (UTC-5), Nasdaq is evolving within a bullish dynamic that has been in place since January 1.
On the 5-minute chart, several elements immediately stand out.
The market is moving higher in a continuous manner.
Moving averages are clearly pointing upward.
Pullbacks remain short and shallow.
We can already observe several successive impulses, with no real pause on the intermediate moving averages.
At this stage, the context does not encourage me to look for an additional bullish impulse on the 5-minute timeframe.
The market is already well engaged, and another extension in the same direction becomes less interesting to work.
So the logical next step is to change the angle of analysis.
I’m going to look for a more structuring zone on a higher timeframe.
👉 Let’s move to the 15-minute analysis.
15-minute timeframe analysis – Reaction zone
On the 15-minute chart, I identify a reaction zone dating back to December 30, 2025.
This zone is located around 25,740.
On December 30, we observed a range phase, followed by a liquidity-seeking candle around 11:30, before the start of a bearish move.
Given the current context, with a very strong trend in place since January 1 and a Nasdaq that is accelerating almost without pause, this zone makes complete sense.
At this stage, this zone clearly represents:
- a level with a high probability of rejection,
- a logical pause point after the ongoing bullish impulse.
I therefore plan to attempt a rejection at this level.
Alright, the 15-minute analysis is complete.
We’ve defined our reaction zone.
And it turns out price is right on it.
I now move to the lower timeframe to try to find an entry point, a setup.
Market reaction on the 1-minute timeframe – Trade trigger
I now switch to the 1-minute chart.
Here, the read is straightforward.
Price comes directly into the reaction zone defined on the 15-minute chart, around 25,740.
On the chart, we can clearly see the impact of price on the zone.
That day, the timing is excellent.
The market reacts immediately and offers me an opportunity right away.
So, after the impact on the zone, on the 1-minute chart, a clean signal appears.
For me, this cuts the bullish dynamic.
The flow turns.
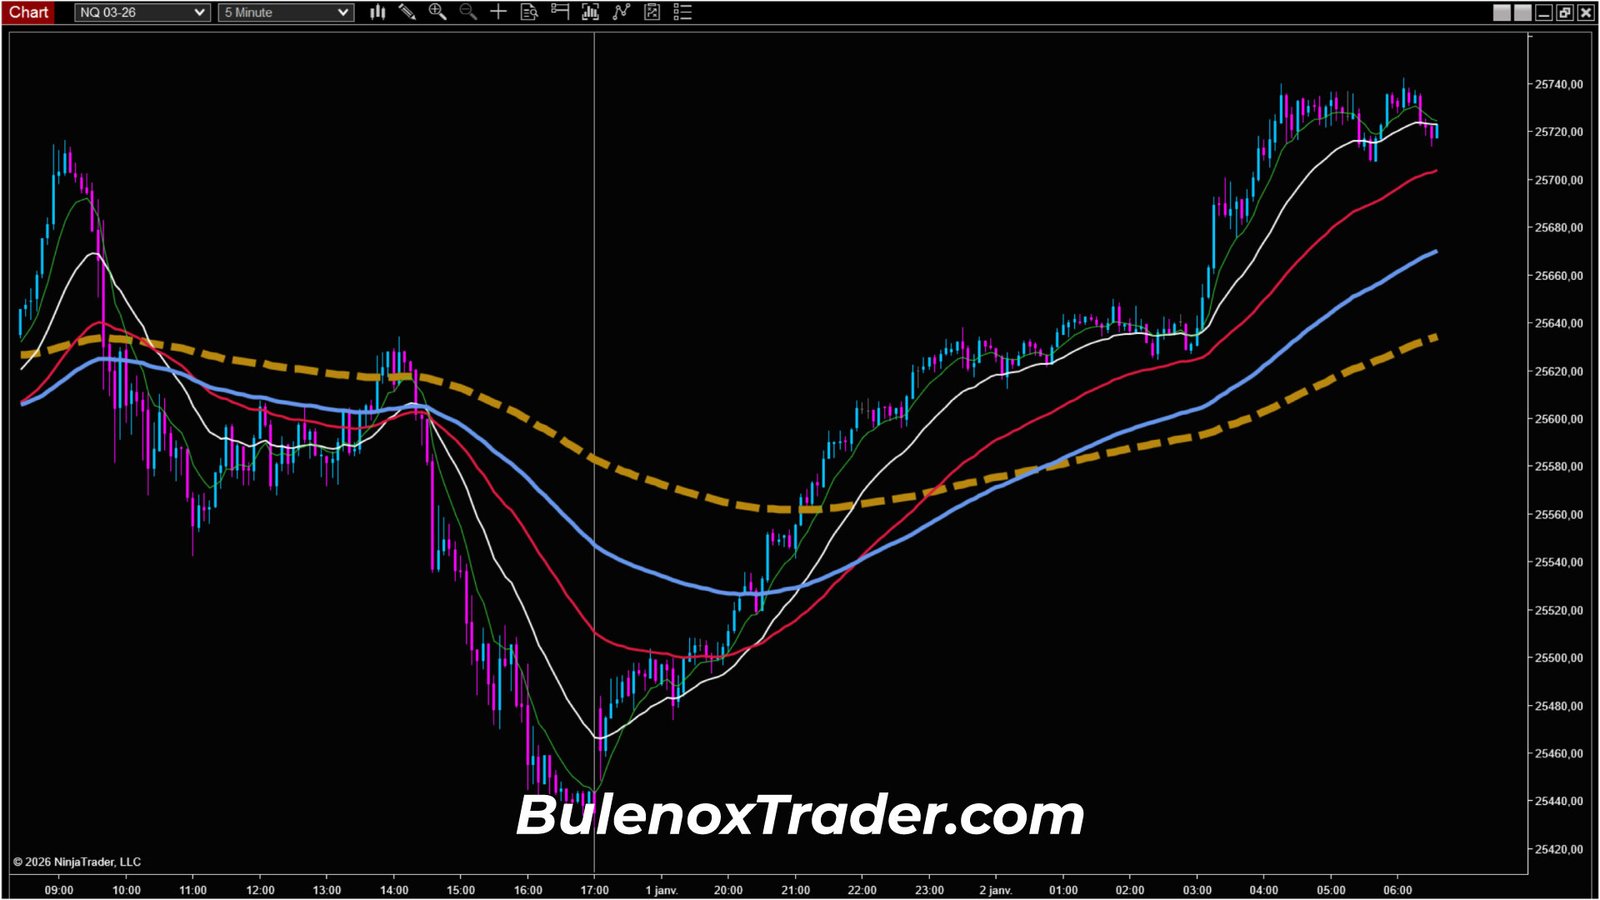
It’s time to enter quickly, around 25,725, with a take profit set near a structuring moving average from the 15-minute timeframe.
In addition, there is a clear confluence with a round price level, around 25,700.
Trade execution and management on the 1-minute chart
Once the setup is validated on the 1-minute timeframe, execution is required.
The entry is taken quickly around 25,725, just after the visible price reaction on the zone defined on the 15-minute chart.
At that precise moment, one element remains central in my read.
Price is still evolving near structuring levels, and nothing completely rules out a bullish continuation if the rejection fails.
Risk management therefore naturally comes into play.
Rather than targeting an uncertain extension, I choose an objective that is consistent with the immediate context.
The target is placed around 25,700, a zone that corresponds simultaneously to:
- a structuring moving average from the 15-minute timeframe,
- a round Nasdaq price level,
- a logical pause zone after the observed impulse.
The goal is to exit with profits before a possible resumption of the bullish trend.
Move development
After entry, we can clearly see the market moving toward the structuring moving average.
The move eventually reaches the target take-profit zone.
The TP is cleanly achieved around 25,700.
The total range captured on this opportunity is approximately 25 points, from 25,725 down to 25,700.
In concrete terms, the gains obviously depend on the contract used, based on money management:
- with 3 micros, this represents around $150,
- with 5 micros, around $250,
- with one mini Nasdaq, those same 25 points represent around $500.
Conclusion – Reading, timing, and discipline

This January 2, 2026 session perfectly illustrates one simple point.
The market was already engaged in a strong bullish dynamic, with no real pause since the previous day.
Looking for an additional extension on the 5-minute timeframe therefore made no sense.
The 15-minute read allowed the identification of a clear reaction zone, built from the structures left on December 30 around 25,740.
This zone represented the last relevant level to exploit in this context.
The market came to work this zone.
The rejection reaction materialized immediately on the 1-minute timeframe.
The entry was taken around 25,725, with a target defined in the 25,700 area, in confluence with:
- a structuring moving average from the 15-minute timeframe,
- a round price level.
The move was executed cleanly.
The trade delivered 25 points, with no further extension and no structural degradation.
This analysis simply shows how, in an already engaged market, working structuring zones on a higher timeframe, combined with validation on a lower timeframe, allows a precise move to be exploited without looking for anything else.
This is exactly the type of read I document day after day to show the opportunities offered by prop firm trading with Bulenox.
See you next time. Peace.
If you want to test Bulenox at a lower cost, you can use the promo code GETFUNDED89 which gives you -89 % on the site => Bulenox.com
Discover more opportunities offered by Bulenox
NQ Bullish Shift Opportunity | Bulenox, February 2, 2026
NQ: Complex Pullback, Bulenox Sniper Entry | January 20, 2026
Break of the Bullish Bias on the Nasdaq | January 16, 2026
Exploiting a Bullish Bias on the Nasdaq | January 15, 2026
How I Trade the Nasdaq with Bulenox | January 14, 2026
