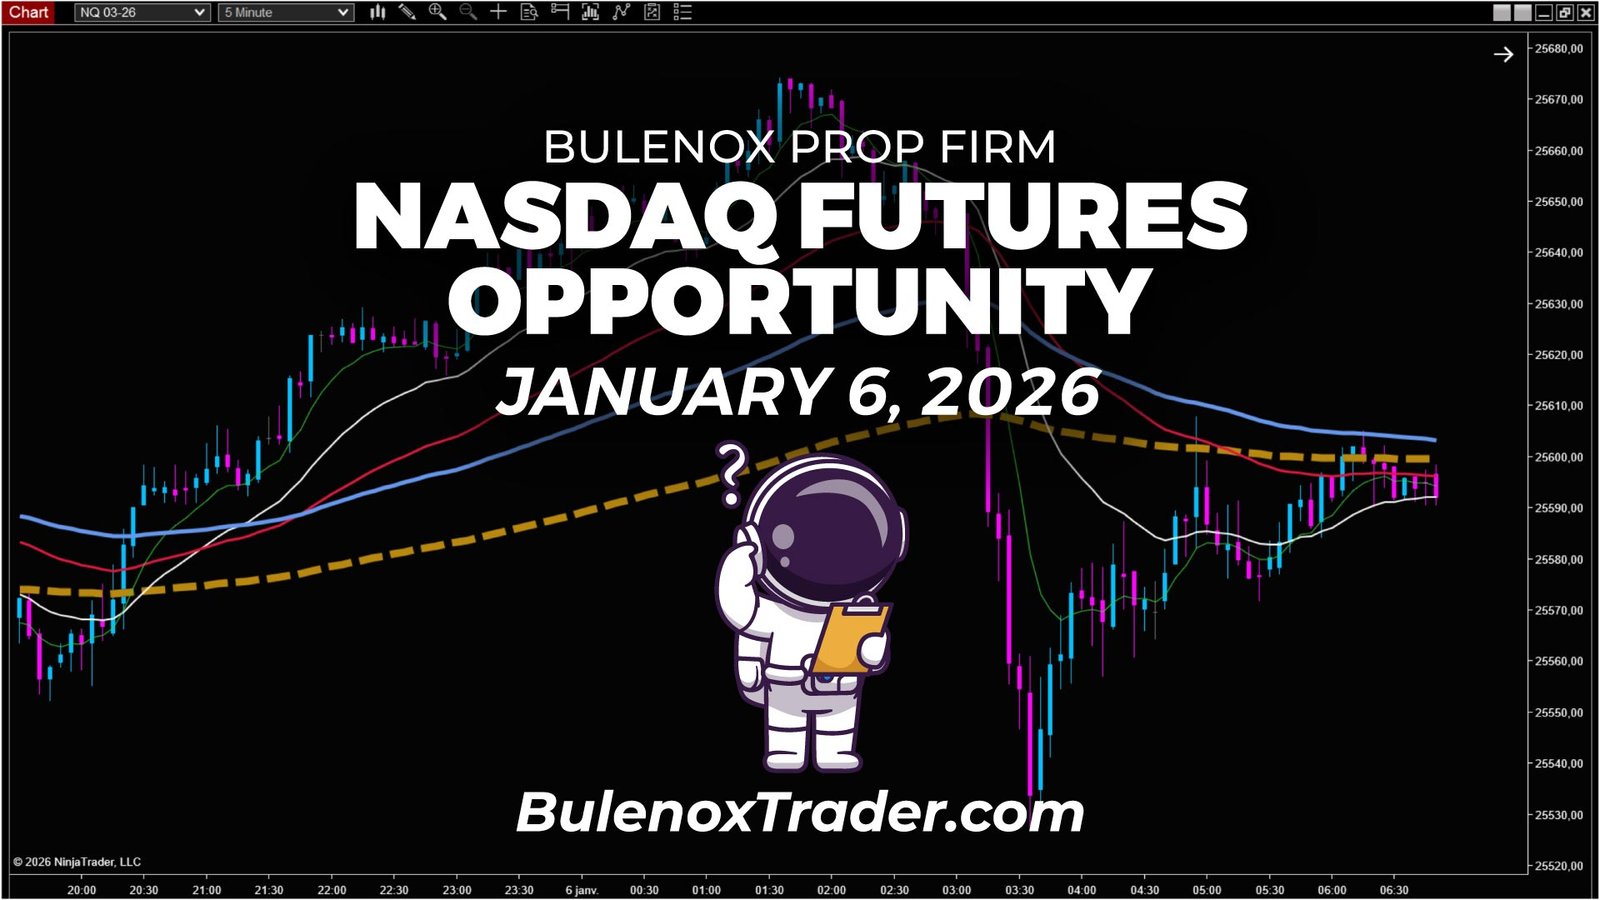
January 6, 2026, New York session.
I scan Nasdaq futures in Bulenox Scalper mode.
Hello, prop firm trader.
As with every session, the analysis starts around 06:50 UTC-5, using a 5-minute chart to establish the market framework before any attempt to intervene.
As usual, the goal is not to trade at all costs, but to understand what the market is actually doing, and more importantly, what it has not done yet.
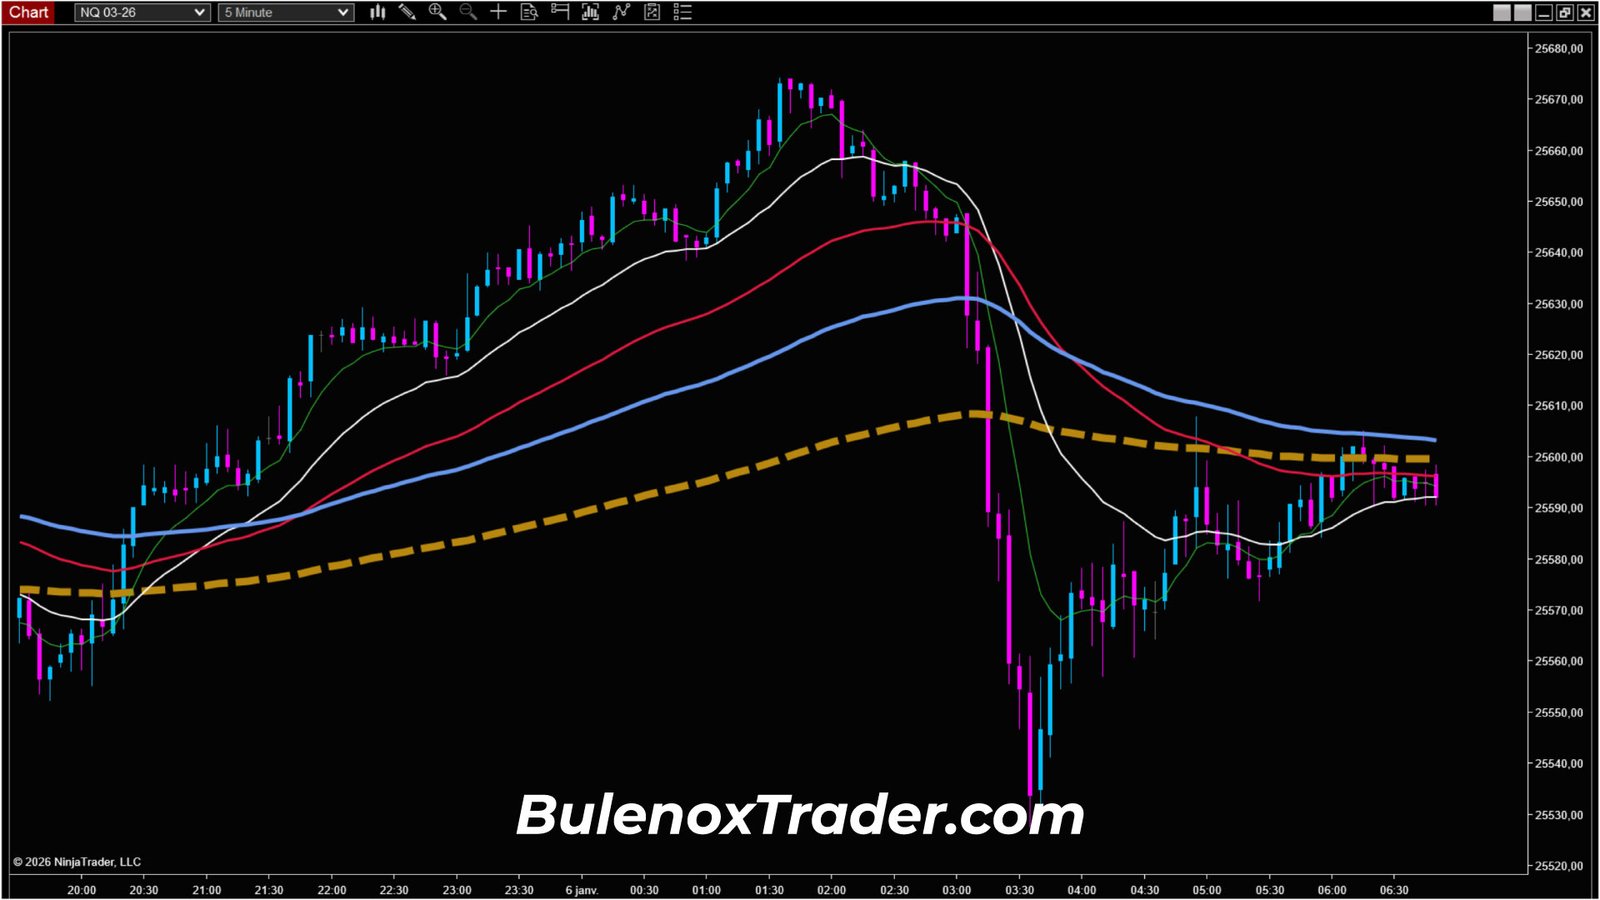
Market context – Nasdaq futures | January 6, 2026 | 5-minute timeframe
At 06:50 UTC-5, the Nasdaq read is not immediate.
The market is coming out of a strong bearish drop observed the day before.
The move was fast, directional, and left a structure still in a digestion phase.
On the 5-minute chart, signals are mixed.
Some recurring moving averages are trading below the baseline moving average, while others remain above it.
The intermediate moving average and the baseline moving average are not coherently aligned.
The conclusion is simple.
The structure is neither clearly bullish nor clearly bearish.
At this stage, I cannot define a clean, exploitable run zone.
The market does not yet offer a clear directional read.
No decision – Waiting for realignment
In this type of configuration, I do not try to anticipate anything.
The read is too hybrid to make a rational decision.
The moving averages are not telling the same story.
Two scenarios remain possible, but neither is validated yet:
- either all moving averages realign below the structuring baseline,
- or they realign above that baseline.
As long as this realignment does not occur, the market remains in an intermediate zone, difficult to exploit cleanly in scalping.
At this precise moment, I have no bias.
I have no entry plan.
I am simply observing.
Mental positioning at this stage
This type of context is an integral part of trading.
There is not always an exploitable opportunity at 06:50.
Forcing a read here would make no sense.
So I let the market do its job.
I wait for new information to appear on the chart.
The session starts this way:
- no trade,
- no anticipation,
- no forced scenario.
Context evolution – Bullish realignment around 08:30 UTC-5
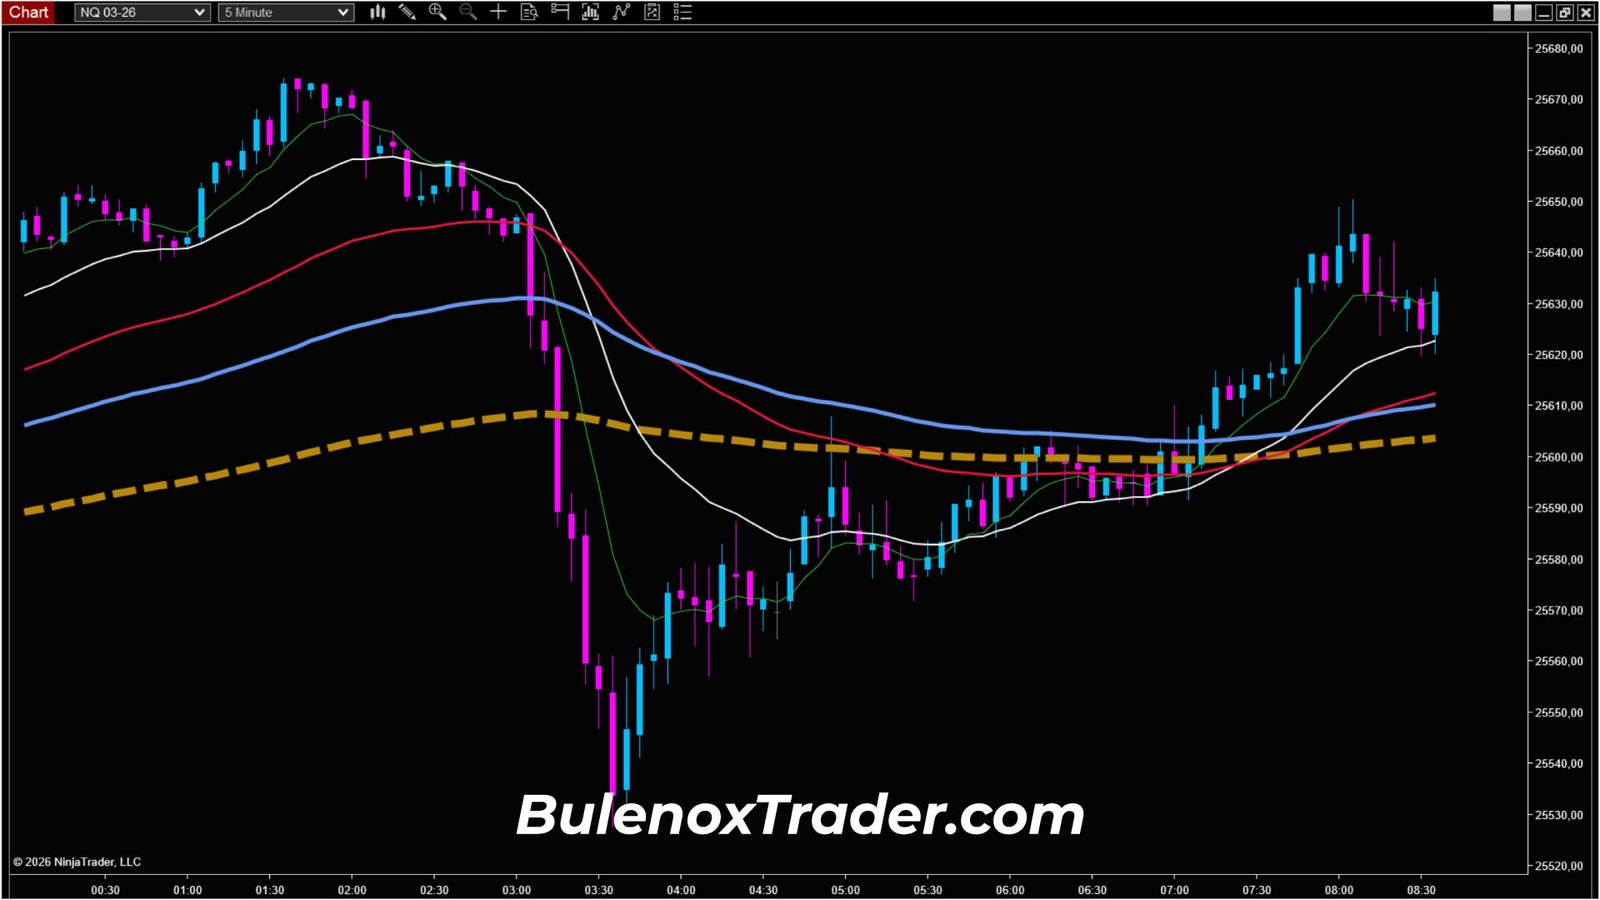
About an hour later, around 08:30 UTC-5, the market read evolves.
On the 5-minute chart, things become more readable.
Moving averages progressively realign to the upside.
The structure changes in nature.
The market is no longer only digesting the previous day’s drop, it starts rebuilding a more coherent dynamic.
This realignment suggests a potential resumption of the bullish trend.
An impulse follows shortly after.
At this stage, a bias begins to form, but I still do not intervene.
The impulse has just started.
Deliberate wait for a correction
As in other sessions, I do not look to enter at the start of the move.
I let the impulse develop.
I wait for a structured, exploitable correction in the direction of the new dynamic.
The idea remains the same.
Do not trade acceleration, trade the pullback.
1-minute timeframe read – Correction around 08:50 UTC-5

Dropping to the 1-minute chart, a first correction appears around 08:50 UTC-5.
Price comes back to work a clear technical zone:
- support on the 50% level of the Donchian channel,
- correction consistent with the bullish structure on the 5-minute chart.
From a purely technical perspective, the setup is interesting.
The market reacts, then resumes higher.
Decision not to enter – US Open context
However, the time context completely changes the read.
This bullish resumption occurs during the US Open.
Volatility increases sharply.
On the 1-minute chart, candles become:
- fast,
- large,
- difficult to manage cleanly with a coherent stop.
Under these conditions, risk is no longer controllable.
Stop levels become fragile.
The read becomes too unstable.
I therefore make a simple and deliberate decision.
I do not enter.
This is not a signal issue.
It is an execution context issue.
Waiting after the US Open
Rather than forcing an entry during an excessively violent phase, I choose to let the US Open pass.
My intention is clear:
- let volatility calm down,
- wait for a second correction,
- regain a more exploitable read on the lower timeframe.
At this point in the session, the priority is not to trade at all costs,
but to preserve readability and risk management.
New market phase – Correction after 10:50 UTC-5
After the US Open, the market continues to push higher.
This bullish phase extends until around 10:50 UTC-5.
At that point, the dynamic changes.
On the 1-minute chart, my Dynamic FiboTrend indicator signals a short-term regime change.
The read temporarily turns bearish.
This is not a major trend reversal, but a retracement within a structure that remains bullish on the higher timeframe.
I am not looking to sell.
I am looking to understand where the correction may end.
Waiting for a correction into a key zone
In this context, I let the market correct.
My focus shifts to a precise zone.
The 50% level of the Donchian channel on the 5-minute chart.
This zone corresponds to a classic breathing area in this type of configuration.
The pullback gradually develops and comes into this zone.
At this stage, I still do nothing.
I wait for confirmation on the lower timeframe.
Resumption signal – Preparing to intervene
Around 12:00 UTC-5, the read evolves again.
On the 1-minute chart, the Dynamic FiboTrend flips back to bullish.
The correction is complete.
The resumption structure is in place.
The context is now different from the US Open:
- volatility is exploitable again,
- candles are more readable,
- risk levels can be defined cleanly.
All elements start to align.
From this moment on, an intervention becomes conceivable.
Trade trigger – Validation by Dynamic FiboTrend
Around 12:00 UTC-5, the context finally becomes exploitable.
On the 1-minute chart, the Dynamic FiboTrend clearly turns bullish again.
The correction is complete.
Price has just exited the retracement zone, in alignment with the 5-minute framework.
Volatility is under control.
Candles are cleaner.
Levels are readable.
At this point, entering the market becomes rational.
Entry point – 25,680 zone
For the entry, I do not try to optimize the tick.
I choose a zone consistent with the structure in place.
Price is trading around the 25,680 area.
This zone corresponds to a clean resumption point, validated by the Dynamic FiboTrend on the 1-minute chart.
👉 Entry point: 25,680
Target – Exit before the last high
The last visible high in the structure is located around 25,707.
As usual, I do not aim to exit exactly at the top.
I prefer to secure the exit just before that area.
👉 Take Profit: 25,705
Trade range
The traded move is therefore:
- Entry: 25,680
- Exit: 25,705
👉 Range: 25 Nasdaq points
Financial equivalence
As with other sessions, here are the concrete equivalents:
3 Nasdaq micros
→ 25 points × $2 × 3 = $150
5 Nasdaq micros
→ 25 points × $2 × 5 = $250
1 Nasdaq mini
→ 25 points × $20 = $500
These figures correspond to a standard execution, without excessive leverage, within a prop firm framework.
Conclusion – Discipline and risk management before opportunity

This January 6, 2026 session perfectly illustrates a fundamental point of prop firm trading.
Knowing when not to trade is part of the process.
The session begins in an uncertain context.
- The previous day’s drop leaves a still-confused structure.
- Moving averages are not aligned.
- No clear directional read emerges at 06:50 UTC-5.
Rather than forcing a decision, the choice is simple.
Wait.
When the market begins to realign bullishly, a first impulse appears.
But this phase occurs during the US Open, in a context of excessive volatility.
- Candles become difficult to manage.
- Stops lose their coherence.
Once again, the decision is clear.
Do not enter, in order to preserve clean risk management.
Only after letting the US Open pass and waiting for a second correction does the market offer an exploitable opportunity.
- The correction develops down to the coherent technical zone at the 50% level of the Donchian channel on the 5-minute chart.
- The resumption is then confirmed on the lower timeframe via a Dynamic FiboTrend signal.
This trade is based on a simple, repeatable logic:
- a bullish framework validated on the 5-minute chart,
- a correctly identified phase of uncertainty,
- a deliberate absence of trading during the US Open,
- a complete correction,
- a return to a key technical zone,
- a resumption confirmed on the lower timeframe,
- followed by a clean execution in a readable context.
The entry is taken in a more stable environment, with a clear read and manageable risk.
No rush.
No anticipation.
Only reading, waiting, and execution.
This is exactly the type of logic I aim to document, day after day, within a prop firm scalping framework with Bulenox.
See you next time.
Peace.
If you want to test Bulenox at a lower cost, you can use the promo code GETFUNDED89 which gives you -89 % on the site => Bulenox.com
Discover more opportunities offered by Bulenox
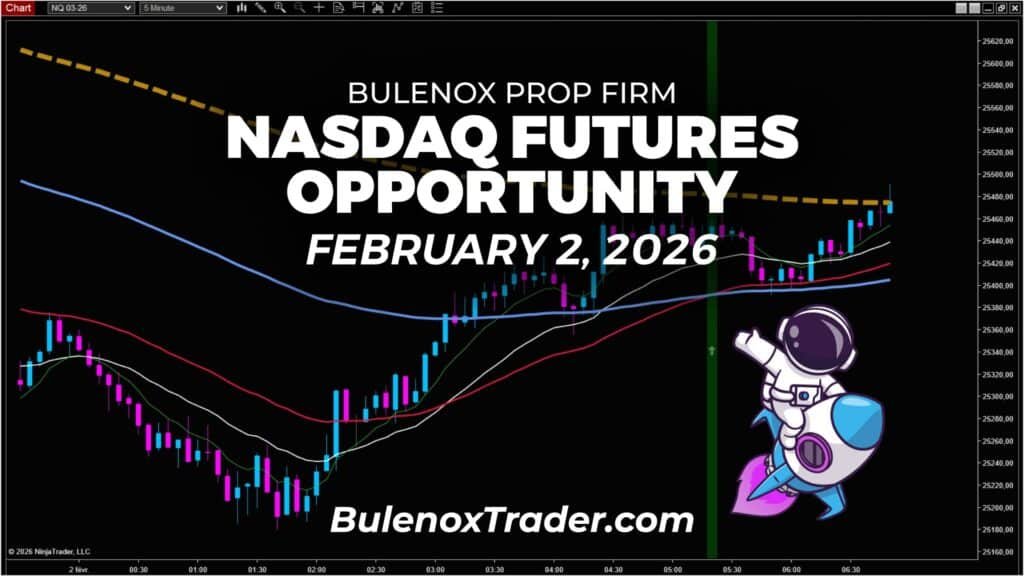
NQ Bullish Shift Opportunity | Bulenox, February 2, 2026
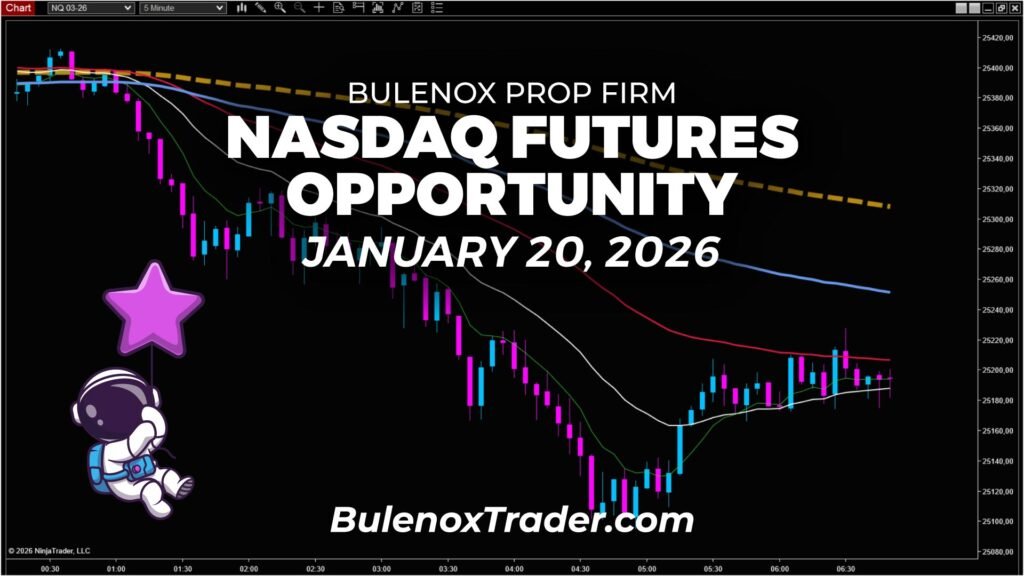
NQ: Complex Pullback, Bulenox Sniper Entry | January 20, 2026
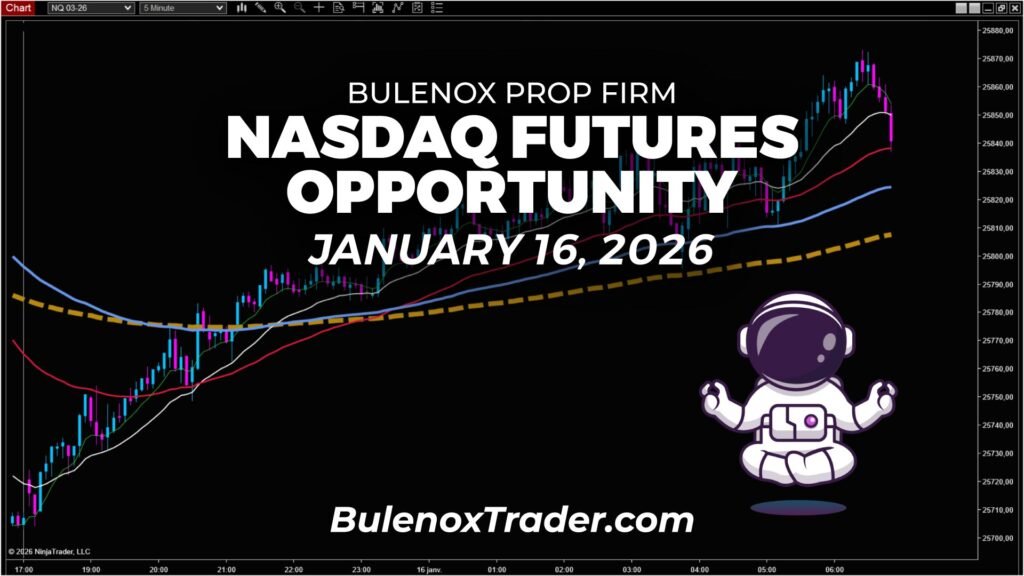
Break of the Bullish Bias on the Nasdaq | January 16, 2026
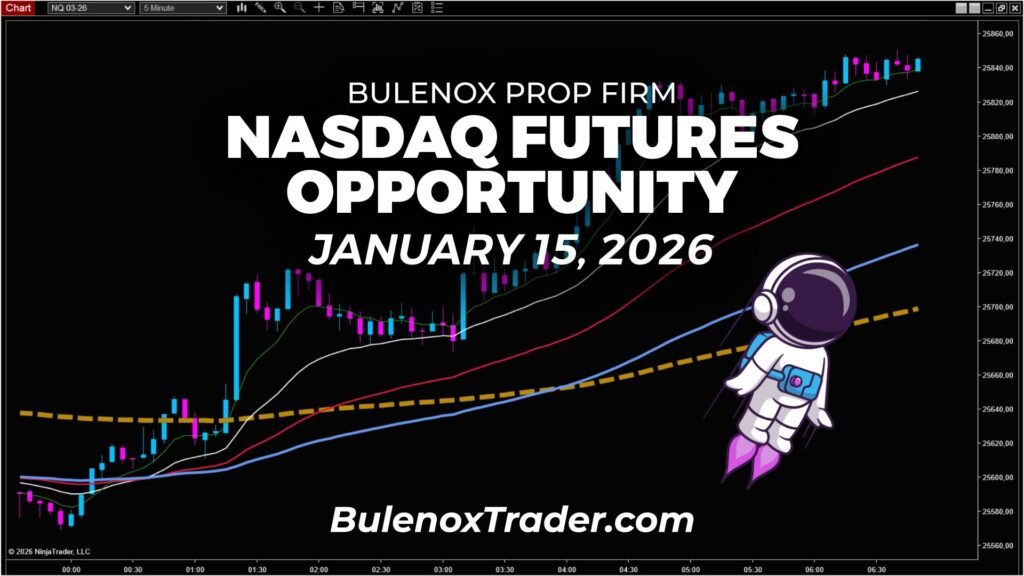
Exploiting a Bullish Bias on the Nasdaq | January 15, 2026
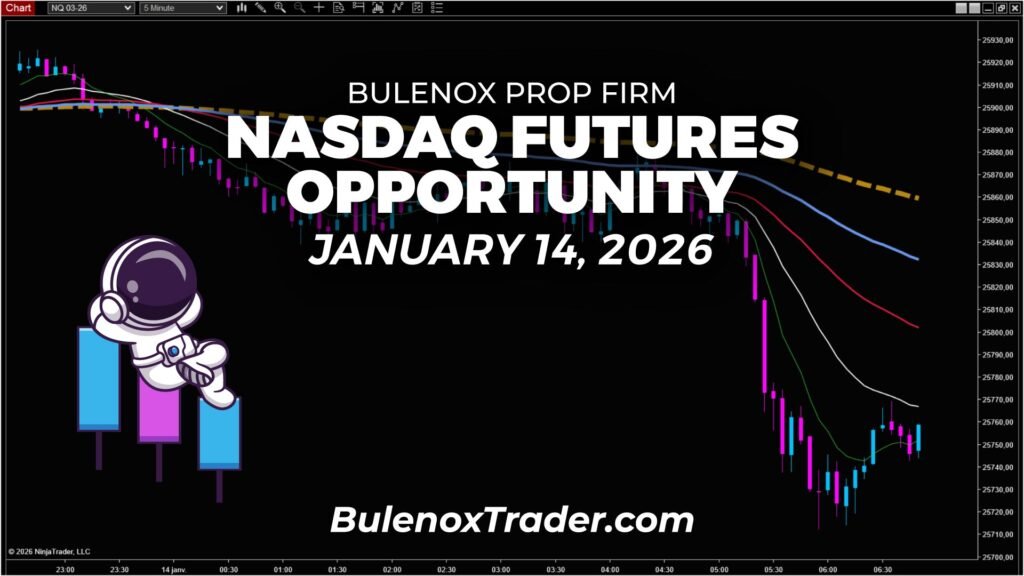
How I Trade the Nasdaq with Bulenox | January 14, 2026
