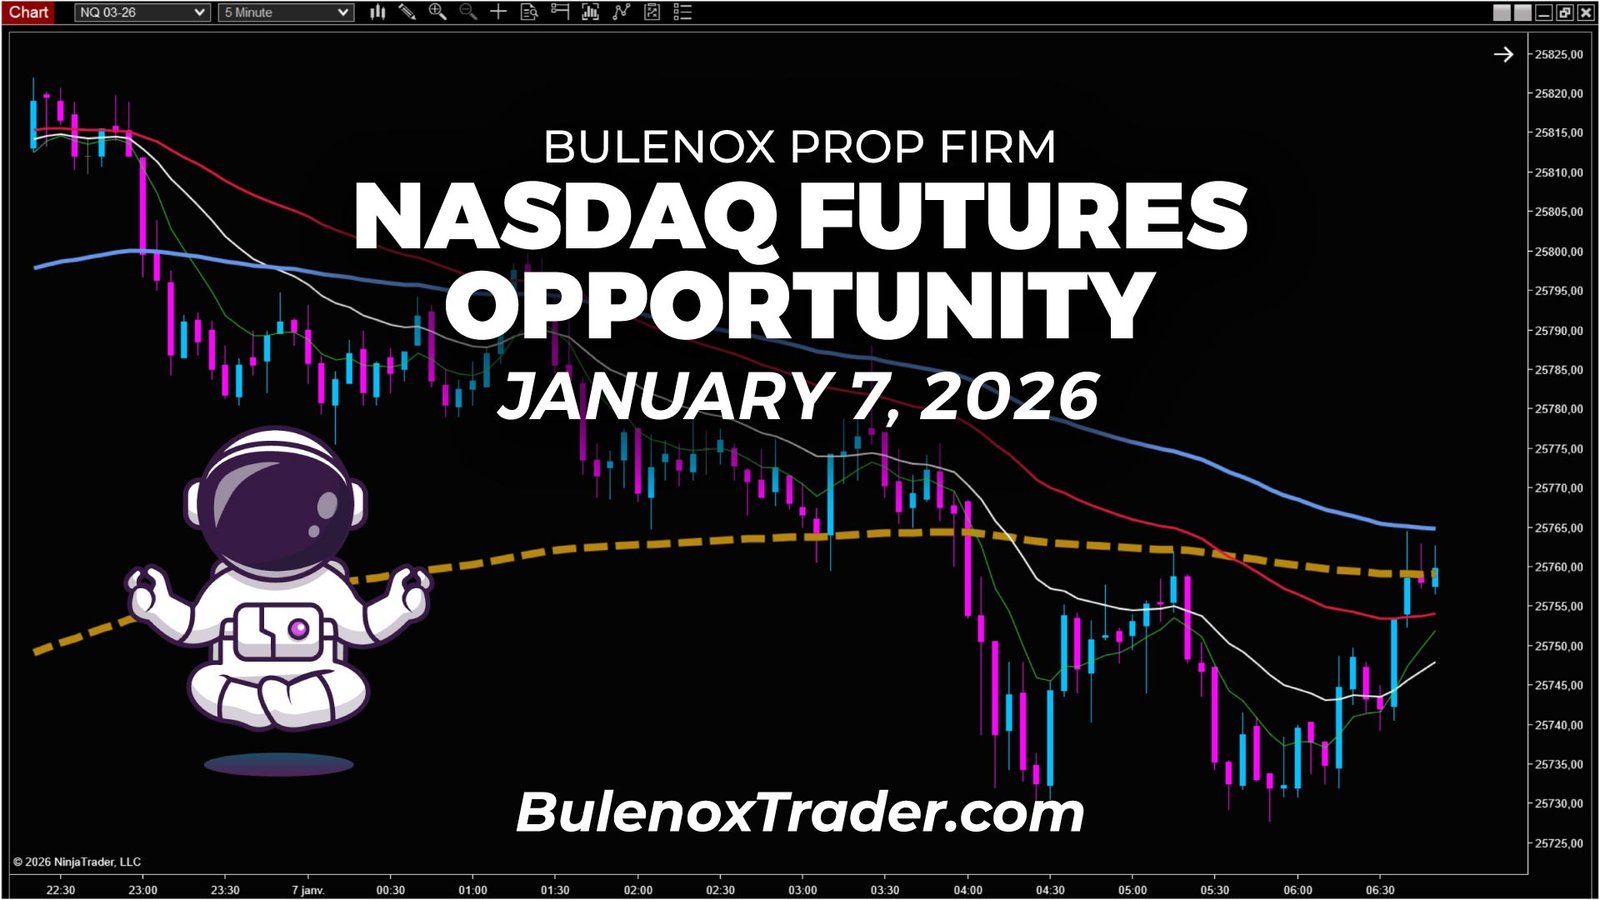
January 7, 2026, New York session.
I’m in front of Nasdaq futures, in a scalping context with the Bulenox prop firm.
The session starts with a market read around 06:50 UTC-5, using a 5-minute chart, in order to identify the existing structure before making any decision.
At this stage, the goal is not to look for an opportunity, but to observe market behavior and the zones it is currently building.
Market context – Nasdaq (NQ) | January 7, 2026 | 5-minute timeframe
At 06:50 UTC-5, the Nasdaq read is relatively clear, but still incomplete.
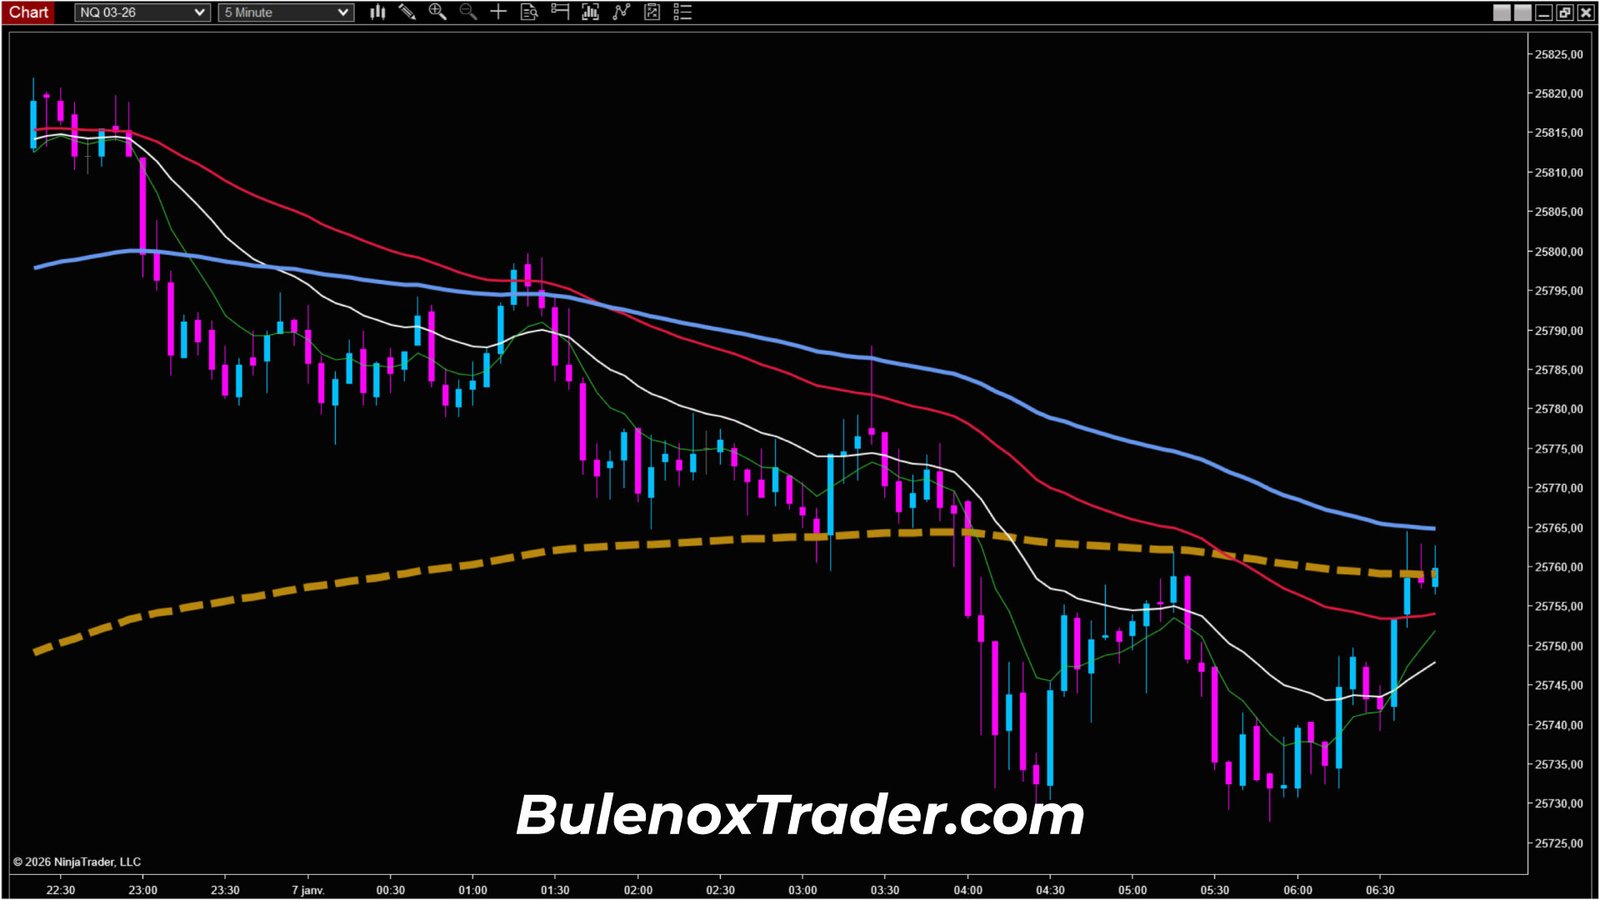
As you can see on the 5-minute chart, the market is evolving within a bearish trend that has been in place for several hours.
This bearish dynamic is gradually pushing price toward the baseline structuring moving average, which acts here as a trend reference.
Price comes to test this baseline moving average.
However, it remains above it.
At this stage, not all structuring moving averages are aligned below the baseline.
The structure therefore does not validate an immediate bearish continuation.
The read is as follows:
- bearish pressure exists,
- price is reaching a key zone,
- but the market does not yet validate a clear directional scenario.
In this context, no decision is required.
No decision – Preserving money management
Faced with this configuration, I do not try to anticipate.
As you can see on the snapshot, the market is sitting in a temporary balance zone.
Entering here would mean forcing a read, without a truly exploitable Risk/Reward.
At this precise moment:
- I have no validated bias,
- I have no entry plan,
- I am simply observing.
This choice is deliberate.
It aims to preserve money management from the very start of the session.
Bullish realignment – Context evolution around 09:55 UTC-5
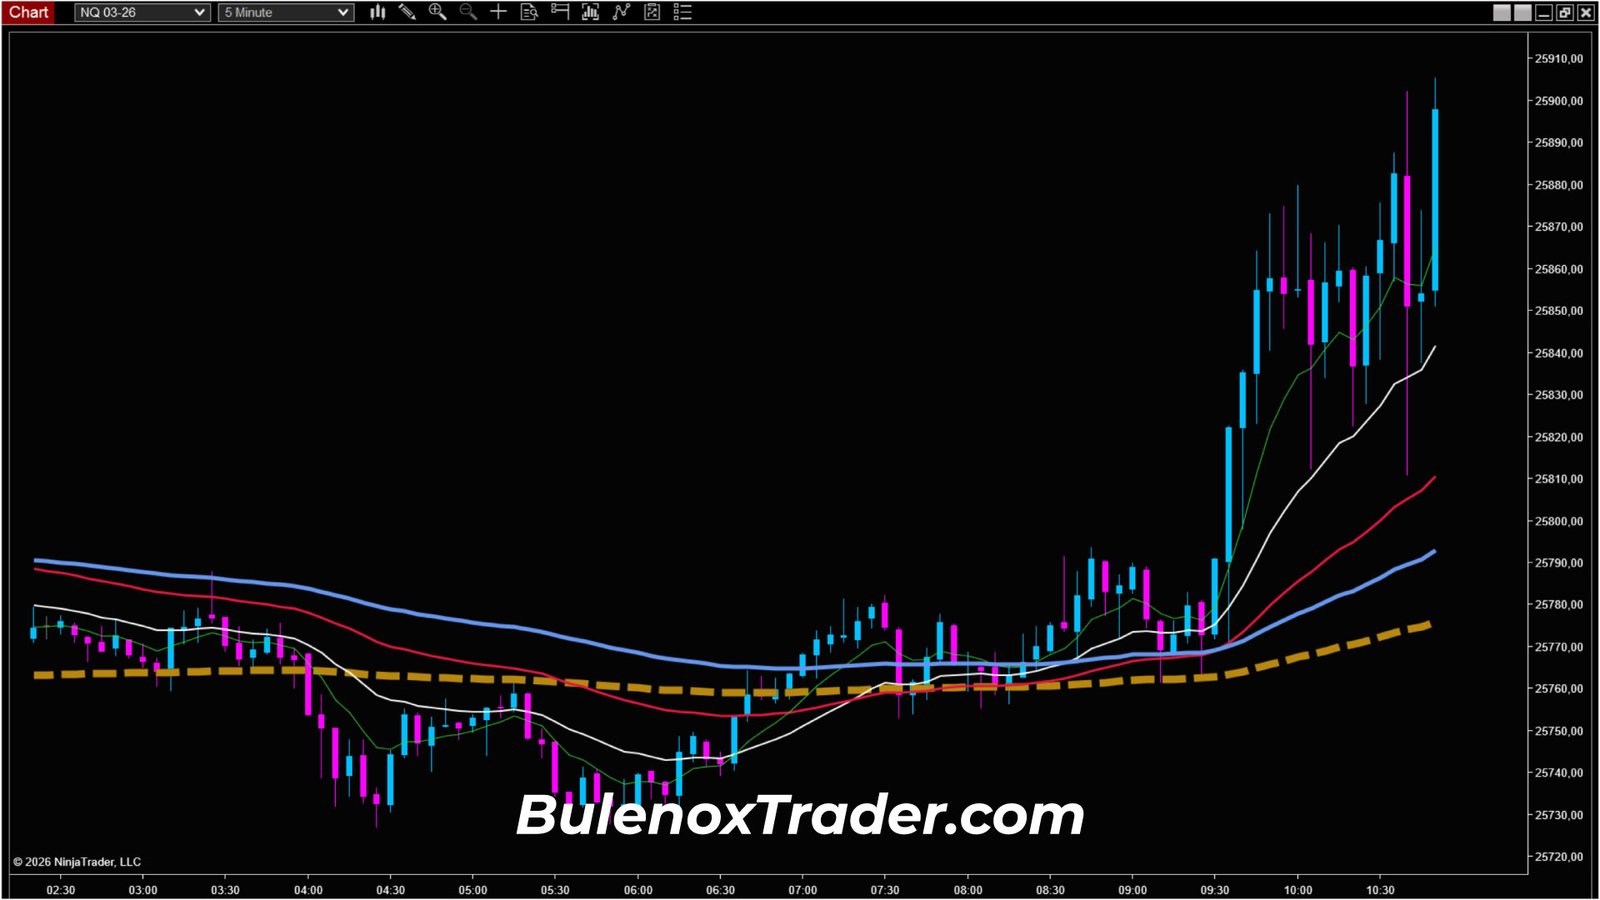
Around 09:55 UTC-5, the market read evolves clearly.
As you can see on the 5-minute chart, all structuring moving averages begin to realign to the upside.
Price progressively lifts away from the support zone and regains height.
This realignment changes the nature of the structure:
- the bearish phase ends,
- a bullish dynamic starts to form,
- the market regains directional coherence.
From that point on, a bullish bias becomes exploitable, provided that Risk/Reward remains coherent.
I still do not intervene.
The impulse is underway.
Waiting for a correction – Scenario construction
As shown in the animation, I never look to intervene on a raw impulse.
I let the market develop.
I wait for a pullback, a structured and exploitable correction, in the direction of the new bullish dynamic.
The objective is clear:
- avoid emotional entries,
- wait for a readable zone,
- prepare a clean execution.
1-minute timeframe read – First signs of correction
Dropping down to the 1-minute chart, additional information appears.
Around 10:40–10:45 UTC-5, as you can see on the snapshot, the Dynamic FiboTrend temporarily flips to a bearish bias.
This signal does not indicate a major trend reversal, but rather the beginning of a correction.
I am not looking to sell.
I am looking to understand where the correction may end.
At this stage, Risk/Reward is not yet favorable.
I remain on hold.
Structured correction – Key technical zone
The correction develops progressively.
As shown on the 5-minute chart and the 1-minute snapshot, price comes to work a coherent technical zone, in alignment with the Dynamic FiboTrend.
Around 11:29 UTC-5, the market makes a clean support reaction on this zone.
The correction slows down.
The higher-timeframe context remains bullish.
The structure stabilizes.
Resumption signal – Validation on the 1-minute timeframe
Shortly after, the Dynamic FiboTrend flips back to bullish.
As you can see on the snapshot, flow changes.
The correction is complete.
The resumption starts to organize.
At that moment:
- volatility is manageable,
- candles are cleaner,
- Risk/Reward becomes identifiable,
- money management becomes exploitable again.
All elements begin to align.
Trade trigger – Rational execution
I then decide to intervene.
Entry point – 25,890 zone
Price reacts around the 25,880 area.
Rather than looking for an aggressive entry, I favor a slightly higher but cleaner execution.
👉 Entry point: 25,890
This choice helps stabilize execution while maintaining a balanced Risk/Reward.
Target – Exit before the last high
The last visible high in the structure is located around 25,929.25.
As always, I do not aim to exit exactly at the top.
I prefer to secure the exit just below that zone.
👉 Take Profit: 25,925
Trade range
The traded move is as follows:
- Entry: 25,890
- Exit: 25,925
👉 Range: 35 Nasdaq points
Financial equivalence
Within a standard prop firm framework:
3 Nasdaq micros
35 points × $2 × 3 = $210
5 Nasdaq micros
35 points × $2 × 5 = $350
1 Nasdaq mini
35 points × $20 = $700
These figures illustrate a clean execution, without excessive leverage, within a disciplined money management approach.
Conclusion – Discipline, Risk/Reward, and coherence

This January 7, 2026 session highlights a key aspect of prop firm scalping.
The session starts without an exploitable signal.
The bearish trend brings price into a key zone, but without immediate directional validation.
Rather than forcing a read, the choice is simple: wait.
When moving averages realign to the upside, a bias appears.
But no entry is considered without a prior correction.
The correction then develops into a coherent technical zone, clearly visible on the chart and snapshot.
The resumption is confirmed on the lower timeframe via a Dynamic FiboTrend signal.
The entry is taken in a stable context, with:
- readable Risk/Reward,
- coherent money management,
- execution without rush.
No anticipation.
No emotion.
Only reading, waiting, and execution.
This is exactly the type of logic I aim to document, session after session, within a prop firm scalping framework with Bulenox.
See you next time.
Peace.
If you want to test Bulenox at a lower cost, you can use the promo code GETFUNDED89 which gives you -89 % on the site => Bulenox.com
Discover more opportunities offered by Bulenox
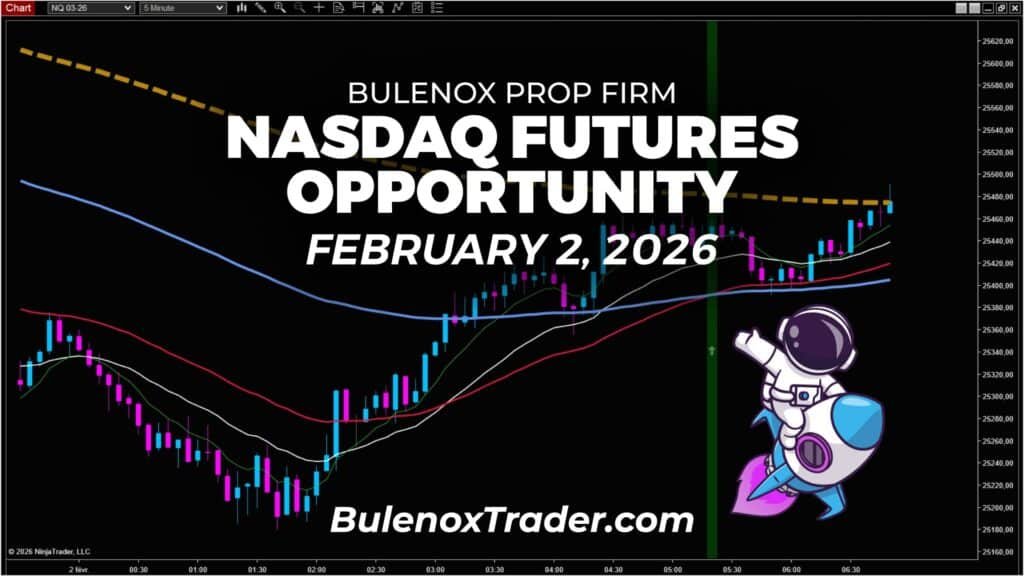
NQ Bullish Shift Opportunity | Bulenox, February 2, 2026
NQ: Complex Pullback, Bulenox Sniper Entry | January 20, 2026
Break of the Bullish Bias on the Nasdaq | January 16, 2026
Exploiting a Bullish Bias on the Nasdaq | January 15, 2026
How I Trade the Nasdaq with Bulenox | January 14, 2026
