Hello, prop firm trader. We’re back with a new analysis in Bulenox Trader mode.
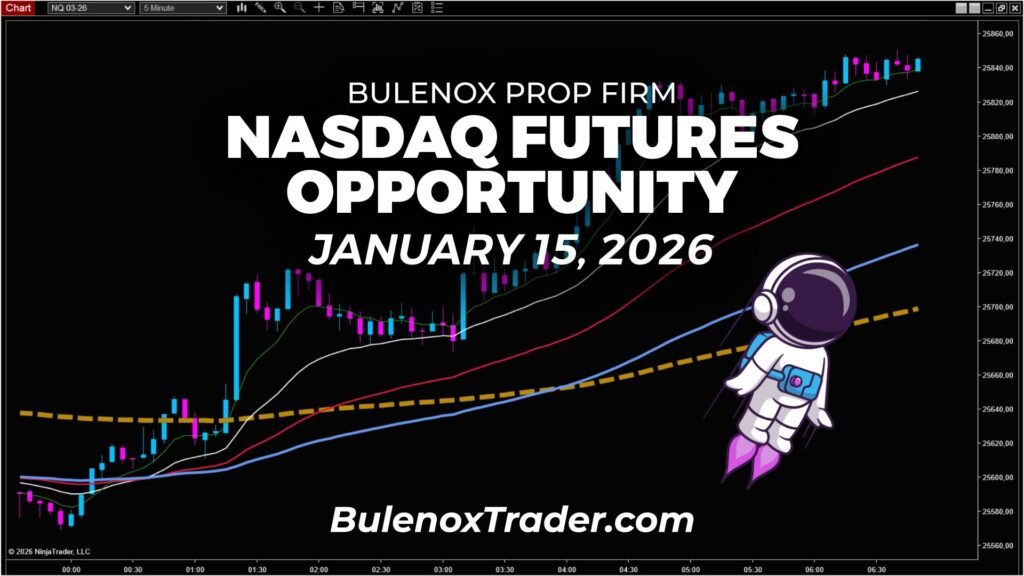
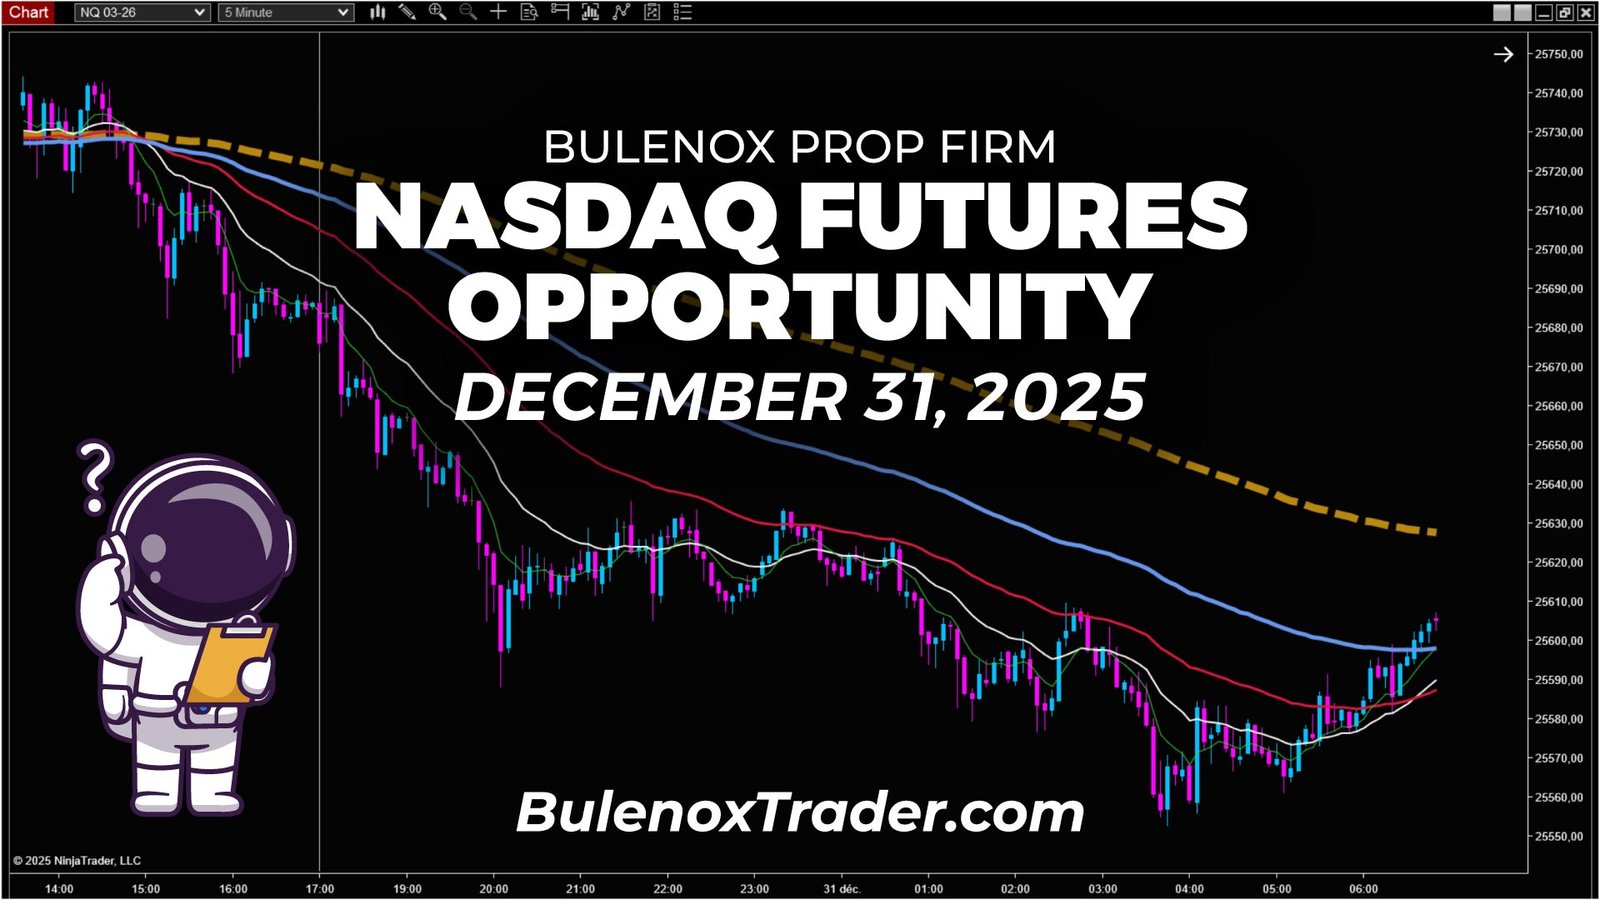
In today’s presentation, I’m offering a detailed read of an opportunity observed during the New York session on December 31, 2025, on Nasdaq futures (NQ). Pure scalping with the Bulenox Prop Firm, as usual.
Alright, let’s get started.
Nasdaq Futures Market Context | December 31, 2025 | 5-minute timeframe

Scenarios considered on the 5-minute chart
On the 5-minute timeframe, two natural scenarios are considered sequentially.
Scenario 1 – Intermediate moving average (blue)
Around 06:50 (UTC-5), price approaches a first logical level on the 5-minute chart: the intermediate moving average (blue).
On paper, the level makes sense. It fits within the bearish structure already in place.
I then switch to the 1-minute timeframe to validate the scenario.
Immediate observation: the flow remains strong, no loss of momentum, no readable rejection structure.
👉 Scenario invalidated.
The 1-minute filter does not confirm. No trade is taken.
That’s unfortunate, because for once it could have allowed an early end to the trading day. But that’s part of the process. Patience is required, and another opportunity must be targeted.
Scenario 2 – Baseline trend moving average (5-minute)
After breaking through the first level, the market continues higher and comes to test a second natural level on the 5-minute chart: the baseline trend moving average.
Again, the logic is clear. After an extension, the market can pause on this type of level.
Another check on the 1-minute timeframe.
And once again: no slowdown, no exploitable reaction, bullish flow remains dominant.
👉 Scenario invalidated as well.
Ultimately, the 5-minute chart does not provide any exploitable entry point in this context.
Moving to higher timeframe analysis
Since both natural 5-minute levels are crossed without validation on the lower timeframe, the 5-minute read becomes insufficient to trigger a trade.
If you look at the 1-minute chart at that moment, it’s very clear:

- the flow never stops
- price progresses continuously
- no pause
- no rejection structure
- no exploitable signal
The 1-minute chart perfectly illustrates this point.
The market is moving, but it simply offers no clean point of intervention.
This is not a failure of the plan.
It’s a misalignment between the market and my entry criteria.
👉 Logic therefore forces me not to push anything and to move to a higher timeframe to identify a truly structuring level.
This naturally leads to the 15-minute read.
15-minute analysis – Structuring levels
Since both scenarios considered on the 5-minute chart were invalidated by the lower timeframe filter, the 5-minute read is no longer sufficient to trigger a position.
I deliberately switch to a higher timeframe, the 15-minute chart, to identify a more structuring level capable of generating a real market reaction.
On the 15-minute chart, the read is similar.
We can observe that, since the previous day, moving averages have progressively aligned to the downside.
The bearish dynamic is clearly in place and readable.
Price first comes to work a first structuring moving average on the 15-minute chart (blue on the chart above).
On paper, the level makes sense.
But once again, the 1-minute filter validates nothing:
- no slowdown in flow
- no readable rejection
- no exploitable structure
👉 This level is crossed without reaction.
No entry is considered.
The market then continues higher and, around 09:00 (UTC-5), comes to test the last structuring moving average on the 15-minute chart: the baseline trend moving average (210).
This time, the context is different.
This level meets several important criteria:
- it is a higher-timeframe baseline level
- it has not yet been worked
- it aligns with the prevailing bearish dynamic
- it coincides with a round psychological level, around 25,700
At this stage, we are reaching the last relevant zone to exploit according to my reasoning.
This is my final potential short entry for the day.
If there is no reaction here, there will simply be no trade.
The scenario was clearly defined before price even reached the zone.
What follows depends solely on the market’s reaction at this level, on the lower timeframe.
1-minute analysis – Reaction and trigger
Alright, price has now reached my zone defined on the 15-minute chart, so I immediately switch back to the 1-minute timeframe.
This is the only place where the decision is made.
The role of the 1-minute chart is simple:
confirm or invalidate the scenario defined upstream.
As price approaches 25,700, several elements gradually appear on the chart:
- bullish flow slows
- candles lose amplitude
- price starts to pull back, interpreted as liquidity being taken
Unlike the previous levels, the reaction is finally readable.
The structure becomes exploitable.
I then observe:
- a loss of bullish dominance
- a first rejection attempt
- a signal from one of my indicators
The read is consistent with what is expected since 06:50 in this type of configuration:
a structuring level reacting, and the 1-minute chart starting to translate it visually.
Important clarification: the signal does not come from a single isolated indicator.
It comes from the combination of:
- the higher-timeframe baseline level (15-minute)
- the slowdown in flow
- the structure forming on the 1-minute chart
From that point on, my setup is considered valid.
In this case, I can trigger a short entry around the 25,680 area, in line with the bearish dynamic identified from the higher timeframes.
What follows now is trade management and the deliberately conservative choice of the target.
Trade execution and management on the 1-minute chart
Once the setup is validated on the 1-minute chart, I can finally move to execution.
The entry is taken around the 25,680 area, deliberately not at the high, after the reaction becomes clearly visible on the 1-minute chart.
I’m not trying to optimize the tick. I’m trying to be in the move, not to guess it.
At that precise moment, one element remains in mind:
price is still trading above the 210 moving average on the 1-minute chart.
In other words, the risk of a bullish resumption is not entirely ruled out.
Risk management therefore naturally imposes itself.
Rather than targeting a hypothetical extension, I choose an objective consistent with the immediate context.
The target is placed on the 210 moving average of the 1-minute chart, located around 25,650.
This choice follows a simple logic:
- it is a lower-timeframe baseline level
- it corresponds to a natural pause zone
- it allows capturing the move without exposure to a sharp reversal
The goal is not to prove that the market can go further.
The goal is to validate what the market offers at that precise moment.
Move development
After entry, the market does exactly what it needs to do.
Price gradually pulls back.
The structure remains clean.
No acceleration against the position appears.
The move reaches the predefined target zone.
The exit is executed around 25,650, directly on the 1-minute baseline moving average.
The total range captured on this sequence is approximately 30 points, from 25,680 to 25,650.
In concrete terms, the impact naturally depends on the contract used:
- with 3 micros: approximately $180
- with 5 micros: around $300
- with one mini Nasdaq: approximately $600
Conclusion – Reading before action

This December 31, 2025 session highlights a fundamental point.
A plan is not an obligation to enter.
It is a working hypothesis, subject to validation.
The first two 5-minute scenarios were logical.
They were cleanly invalidated by the lower timeframe filter.
They were therefore not traded.
The market then continued higher until a much more structuring level on the 15-minute chart, where a clear reaction finally emerged on the 1-minute chart.
The trade was not born from random timing.
It was born from a precise sequence:
- a clear hierarchy of timeframes
- levels defined in advance
- validation only when the market speaks
This discipline is what allows staying aligned with the market,
without forcing,
without over-interpreting,
and without multiplying unnecessary trades.
This is exactly the type of reading I document here, day after day,
within a prop firm scalping framework with Bulenox.
We stop here for this session.
See you next time. Peace.
If you want to test Bulenox at a lower cost, you can use the promo code GETFUNDED89 which gives you -89 % on the site => Bulenox.com
Discover more opportunities offered by Bulenox
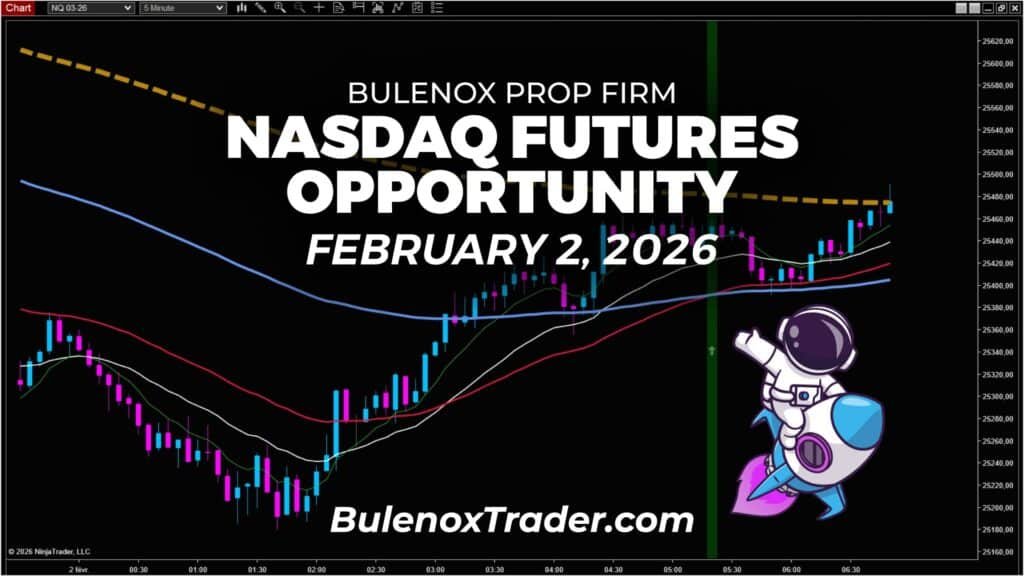
NQ Bullish Shift Opportunity | Bulenox, February 2, 2026
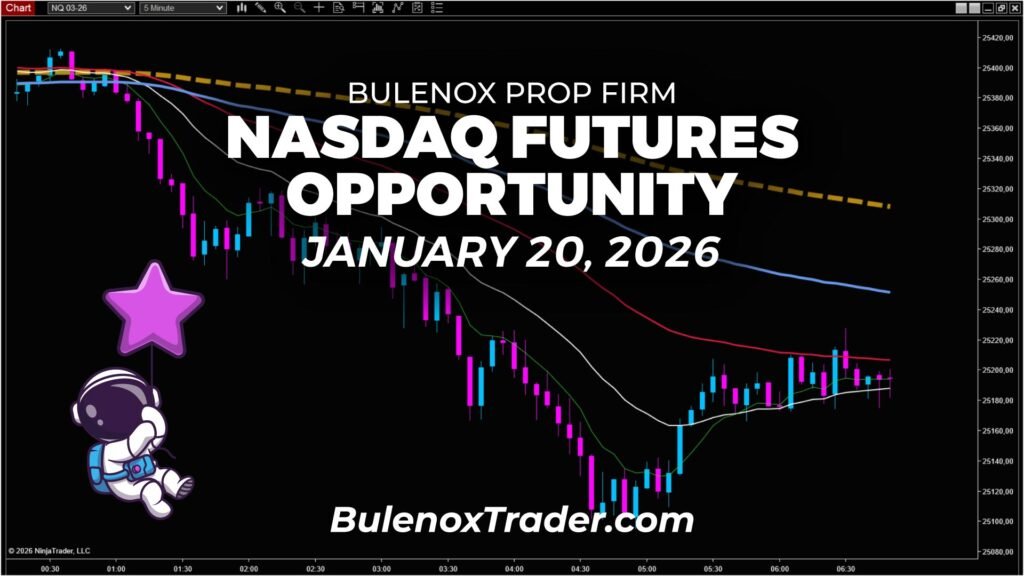
NQ: Complex Pullback, Bulenox Sniper Entry | January 20, 2026
Break of the Bullish Bias on the Nasdaq | January 16, 2026